AVAXUSD at Support ? recent brok the resistanceAVAX has recently broken the Support and is likely to reverse from this support area let us see.

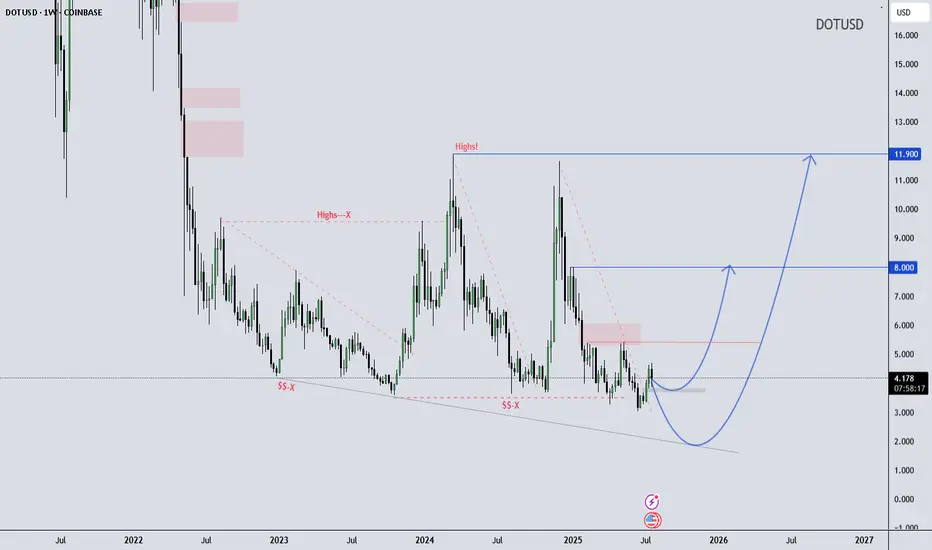
DOT/USD Weekly Structure - - Reversal Possibility Developing DOT/USD Weekly Outlook – Educational Perspective
Polkadot (DOT) is trading near the lower boundary of a long-term falling wedge structure, showing early signs of stabilization around the $4.20 support zone. Price has respected this level multiple times, potentially forming a rounded bottom, whic
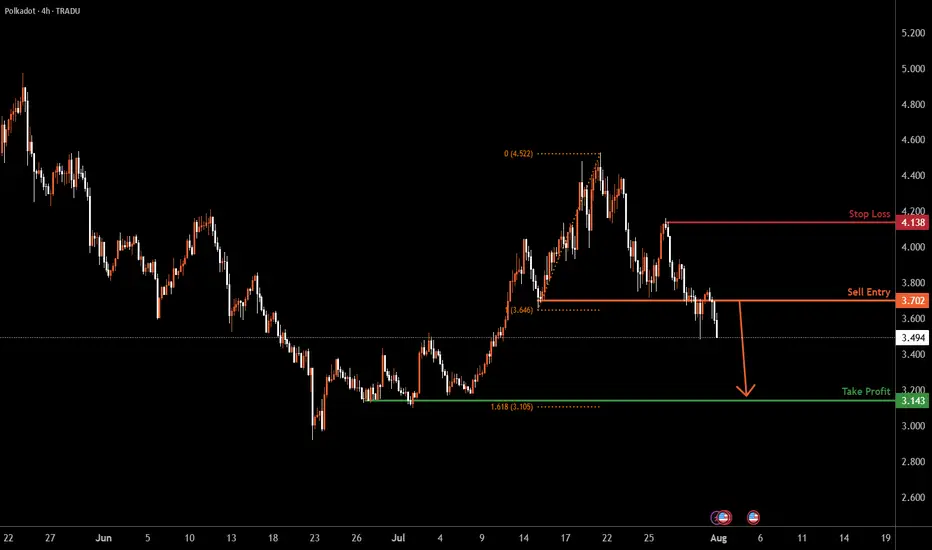
DOTUSD H4 | Bearish dropDOT/USD has rejected the sell entry and could drop lower to the take profit, which acts as a multi-swing low support.
Sell entry is at 3.702, which is a pullback resistance.
Stop loss is at 4.128, which is a potential pullback resistance.
Take profit is at 3.143, which is a multi-swing low suppor
DOTUSD – Bottom Bounce or Trap?DOT dropped hard through $4.13 and 200 SMA but found strong buyers near $3.91. It’s now rebounding with decent RSI momentum, pushing toward $4.08. If this strength holds and price breaks $4.09, a move to $4.13 is possible. But failure to reclaim $4.09 might cap this as just a lower high.

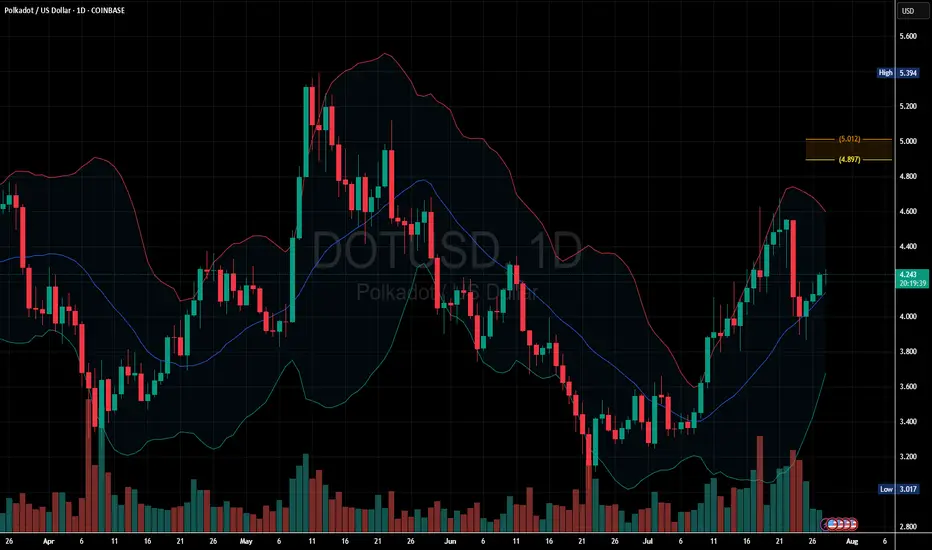
Polkadot Daily Chart: Uptrend Continues Above Mid-Band Support
DOT is trading above the 20-day moving average (middle band of the Bollinger Bands), which is a bullish signal suggesting upward momentum.
If price holds above the middle Bollinger Band, the bullish bias remains intact.
A close below it could weaken the short-term bullish case.
Key support: $4.
DOT Mid-Level Retest — Setup for the Next LegDOT is testing a key breakout level that previously capped the rally. If buyers defend this zone, the next major target sits around $5.50 — but failure here could send it back into range. High reward, high risk setup forming.
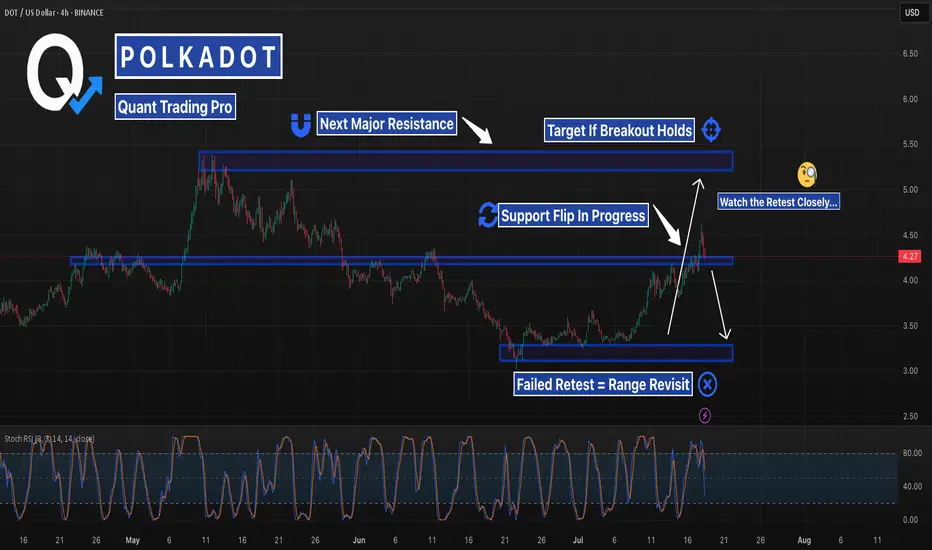
DOTUSD – Trendline Break Retested | Breakout or Trap?Polkadot broke its multi-week descending trendline and reclaimed support, but now faces resistance just above $4.20.
With a clean structure retest and rising momentum, this becomes a classic breakout-or-fakeout setup.
Measured move points to $5.40 if it runs.
Invalidation sends us back to $3.60.
#

SHORT DOTUSDT.P - KrakenLimit Order Set-Up
Entry: 4.058
Take Profit (TP): 3.691
Stop Loss (SL): 4.091
Market Context:
Price is slowly retracing into a Fair Value Gap (FVG) / imbalance zone. However, Open Interest (OI) is decreasing across all derivatives exchanges, while price is climbing — a classic sign of a weak upw

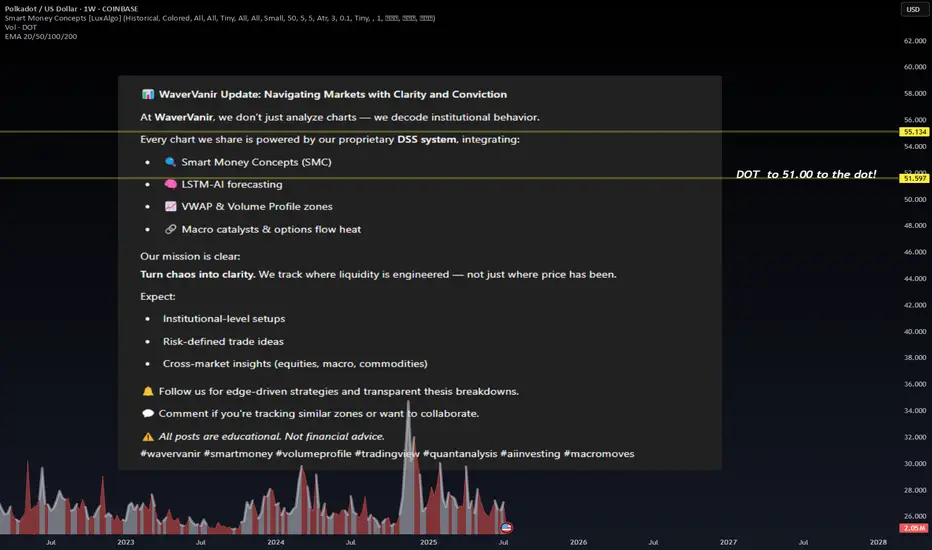
WaverVanir Update: Navigating Markets with Clarity and Convictio📊 WaverVanir Update: Navigating Markets with Clarity and Conviction
At WaverVanir, we don’t just analyze charts — we decode institutional behavior.
Every chart we share is powered by our proprietary DSS system, integrating:
🔍 Smart Money Concepts (SMC)
🧠 LSTM-AI forecasting
📈 VWAP & Volume Prof
DOTUSD – Power Push, Fuel Still in TankDOT exploded from $3.65 and surged through resistance zones to reach $4.18. After a mid-range correction, buyers reloaded with a clean breakout past $4.08. Now pressing into previous local highs. This is a momentum continuation setup unless $4.12 breaks down.
See all ideas
Summarizing what the indicators are suggesting.
Oscillators
Neutral
SellBuy
Strong sellStrong buy
Strong sellSellNeutralBuyStrong buy
Oscillators
Neutral
SellBuy
Strong sellStrong buy
Strong sellSellNeutralBuyStrong buy
Summary
Neutral
SellBuy
Strong sellStrong buy
Strong sellSellNeutralBuyStrong buy
Summary
Neutral
SellBuy
Strong sellStrong buy
Strong sellSellNeutralBuyStrong buy
Summary
Neutral
SellBuy
Strong sellStrong buy
Strong sellSellNeutralBuyStrong buy
Moving Averages
Neutral
SellBuy
Strong sellStrong buy
Strong sellSellNeutralBuyStrong buy
Moving Averages
Neutral
SellBuy
Strong sellStrong buy
Strong sellSellNeutralBuyStrong buy
Displays a symbol's price movements over previous years to identify recurring trends.
Curated watchlists where DOTUSD.P is featured.

Gen 3 crypto: A new day dawns…
25 No. of Symbols

Interoperability Crypto: Communication station
14 No. of Symbols

Polkadot Ecosystem: Spot the best
19 No. of Symbols

Proof of Stake: Seeking validation?
26 No. of Symbols

Smart contracts: Make the smart decision
36 No. of Symbols

Staking Coins: Pick up a stake
18 No. of Symbols

Top altcoins: Choose your alternatives carefully
28 No. of Symbols
See all sparks