AVAXUSD at Support ? recent brok the resistanceAVAX has recently broken the Support and is likely to reverse from this support area let us see.
Key stats
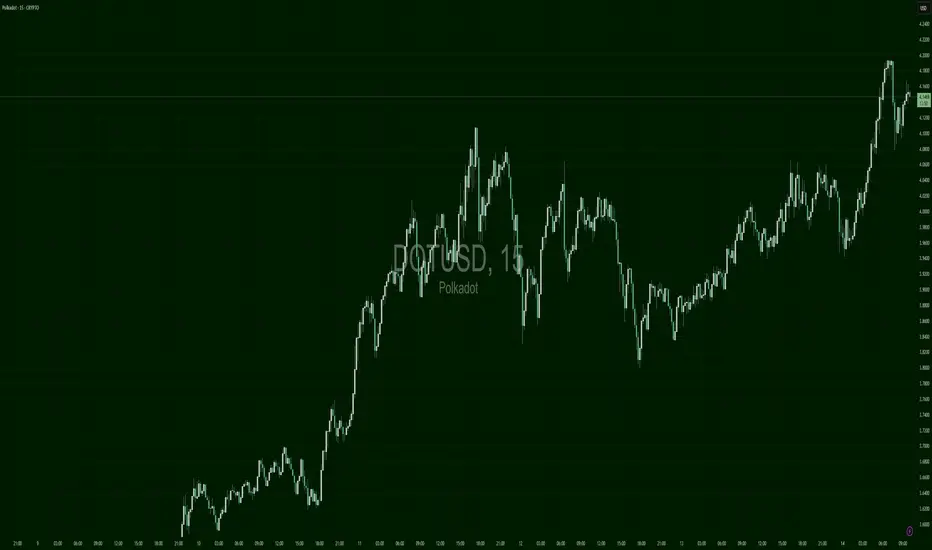
About Polkadot
Launched in 2020, Polkadot is sometimes described as a ‘layer-0’ blockchain as it hosts an ecosystem of blockchains. It’s a ‘parachain’ protocol — which, put simply, means it allows for ease of communication between separate cryptocurrencies. Founder Dr. Gavin Wood (formerly the CTO of Ethereum) sees Polkadot as synonymous with the web3 and its decentralized makeup, which is pretty unsurprising given he literally coined the term in 2014. Its native token DOT is used for staking, governance, and ‘bonding’ — the act of bonding DOT tokens with new chains on the network.
Related coins

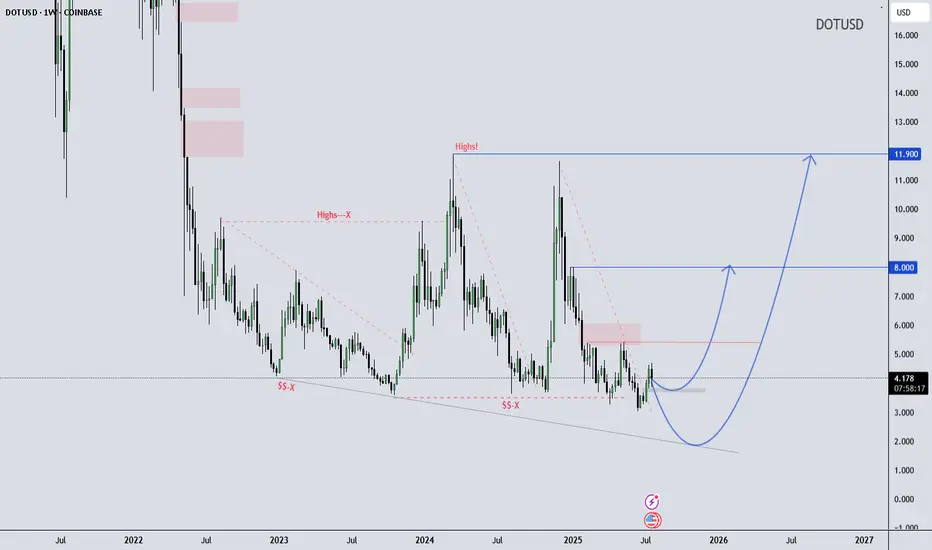
DOT/USD Weekly Structure - - Reversal Possibility Developing DOT/USD Weekly Outlook – Educational Perspective
Polkadot (DOT) is trading near the lower boundary of a long-term falling wedge structure, showing early signs of stabilization around the $4.20 support zone. Price has respected this level multiple times, potentially forming a rounded bottom, whic
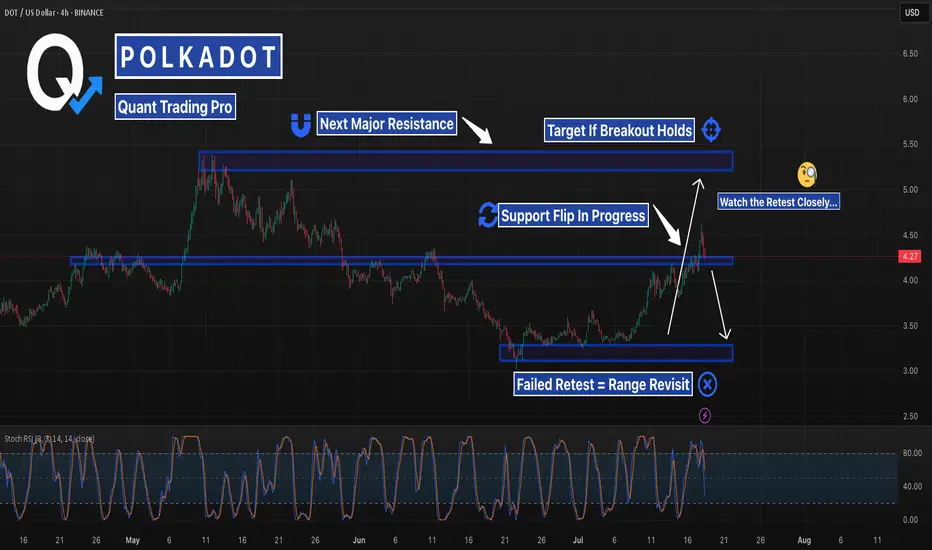
DOT Mid-Level Retest — Setup for the Next LegDOT is testing a key breakout level that previously capped the rally. If buyers defend this zone, the next major target sits around $5.50 — but failure here could send it back into range. High reward, high risk setup forming.
DOTUSD – Bottom Bounce or Trap?DOT dropped hard through $4.13 and 200 SMA but found strong buyers near $3.91. It’s now rebounding with decent RSI momentum, pushing toward $4.08. If this strength holds and price breaks $4.09, a move to $4.13 is possible. But failure to reclaim $4.09 might cap this as just a lower high.

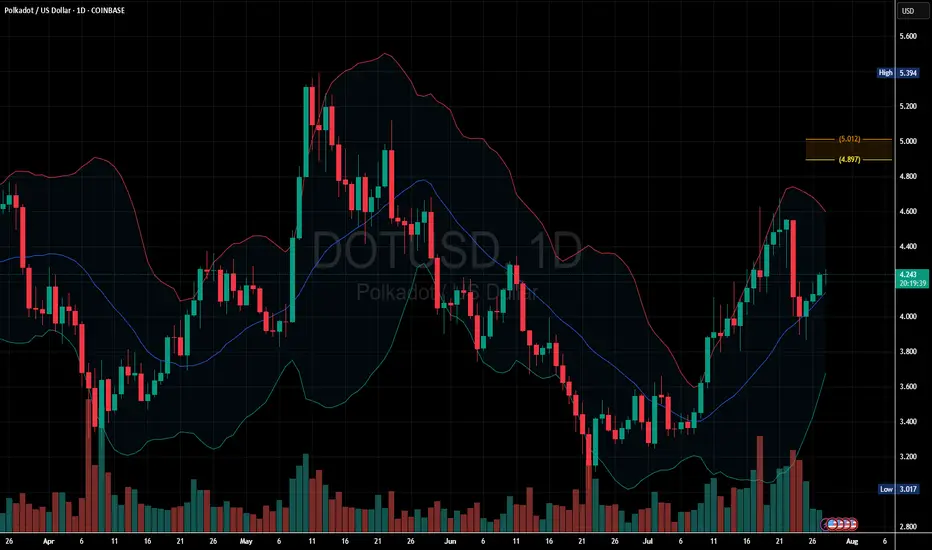
Polkadot Daily Chart: Uptrend Continues Above Mid-Band Support
DOT is trading above the 20-day moving average (middle band of the Bollinger Bands), which is a bullish signal suggesting upward momentum.
If price holds above the middle Bollinger Band, the bullish bias remains intact.
A close below it could weaken the short-term bullish case.
Key support: $4.
DOTUSD – Trendline Break Retested | Breakout or Trap?Polkadot broke its multi-week descending trendline and reclaimed support, but now faces resistance just above $4.20.
With a clean structure retest and rising momentum, this becomes a classic breakout-or-fakeout setup.
Measured move points to $5.40 if it runs.
Invalidation sends us back to $3.60.
#

SHORT DOTUSDT.P - KrakenLimit Order Set-Up
Entry: 4.058
Take Profit (TP): 3.691
Stop Loss (SL): 4.091
Market Context:
Price is slowly retracing into a Fair Value Gap (FVG) / imbalance zone. However, Open Interest (OI) is decreasing across all derivatives exchanges, while price is climbing — a classic sign of a weak upw

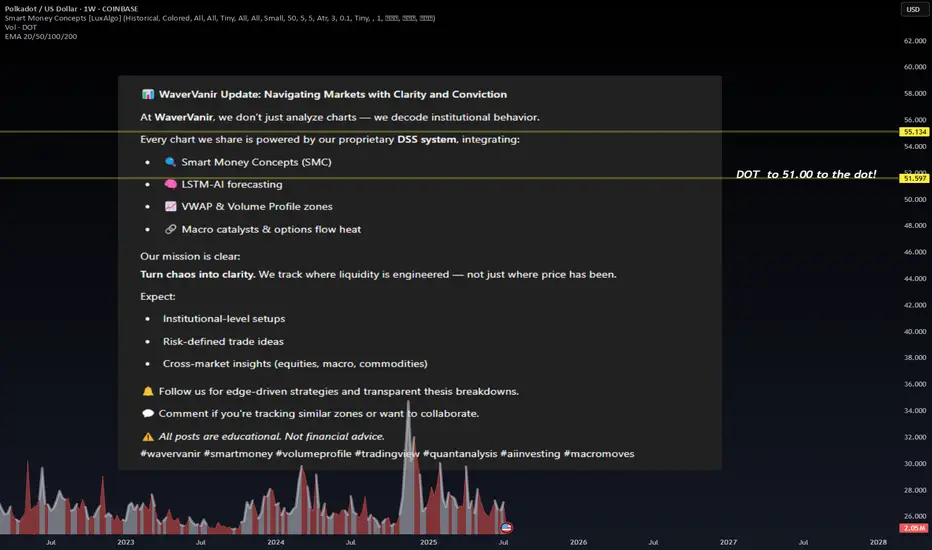
WaverVanir Update: Navigating Markets with Clarity and Convictio📊 WaverVanir Update: Navigating Markets with Clarity and Conviction
At WaverVanir, we don’t just analyze charts — we decode institutional behavior.
Every chart we share is powered by our proprietary DSS system, integrating:
🔍 Smart Money Concepts (SMC)
🧠 LSTM-AI forecasting
📈 VWAP & Volume Prof
DOTUSD – Power Push, Fuel Still in TankDOT exploded from $3.65 and surged through resistance zones to reach $4.18. After a mid-range correction, buyers reloaded with a clean breakout past $4.08. Now pressing into previous local highs. This is a momentum continuation setup unless $4.12 breaks down.
Wyckoff Pattern- To understand trading at its core, you need to understand the Wyckoff Theory.
- Everything you need is in the chart and yes, it's simple and might look like copy-paste, but it's pure Wyckoff.
- Remember this post i made in 2021 ? check it again :
Remember, trading is like a washing machine, i

See all ideas
Summarizing what the indicators are suggesting.
Oscillators
Neutral
SellBuy
Strong sellStrong buy
Strong sellSellNeutralBuyStrong buy
Oscillators
Neutral
SellBuy
Strong sellStrong buy
Strong sellSellNeutralBuyStrong buy
Summary
Neutral
SellBuy
Strong sellStrong buy
Strong sellSellNeutralBuyStrong buy
Summary
Neutral
SellBuy
Strong sellStrong buy
Strong sellSellNeutralBuyStrong buy
Summary
Neutral
SellBuy
Strong sellStrong buy
Strong sellSellNeutralBuyStrong buy
Moving Averages
Neutral
SellBuy
Strong sellStrong buy
Strong sellSellNeutralBuyStrong buy
Moving Averages
Neutral
SellBuy
Strong sellStrong buy
Strong sellSellNeutralBuyStrong buy
Displays a symbol's price movements over previous years to identify recurring trends.
Curated watchlists where DOTUSD is featured.

Gen 3 crypto: A new day dawns…
25 No. of Symbols

Interoperability Crypto: Communication station
14 No. of Symbols

Polkadot Ecosystem: Spot the best
19 No. of Symbols

Proof of Stake: Seeking validation?
26 No. of Symbols

Smart contracts: Make the smart decision
36 No. of Symbols

Staking Coins: Pick up a stake
18 No. of Symbols

Top altcoins: Choose your alternatives carefully
28 No. of Symbols
See all sparks
Frequently Asked Questions
The current price of Polkadot (DOT) is 3.889 USD — it has risen 0.58% in the past 24 hours. Try placing this info into the context by checking out what coins are also gaining and losing at the moment and seeing DOT price chart.
The current market capitalization of Polkadot (DOT) is 6.23 B USD. To see this number in a context check out our list of crypto coins ranked by their market caps or see crypto market cap charts.
Polkadot (DOT) trading volume in 24 hours is 349.83 M USD. See how often other coins are traded in this list.
Polkadot price has fallen by −6.91% over the last week, its month performance shows a 12.65% increase, and as for the last year, Polkadot has decreased by −29.48%. See more dynamics on DOT price chart.
Keep track of coins' changes with our Crypto Coins Heatmap.
Keep track of coins' changes with our Crypto Coins Heatmap.
Polkadot (DOT) reached its highest price on Nov 4, 2021 — it amounted to 55.134 USD. Find more insights on the DOT price chart.
See the list of crypto gainers and choose what best fits your strategy.
See the list of crypto gainers and choose what best fits your strategy.
Polkadot (DOT) reached the lowest price of 3.017 USD on Jun 22, 2025. View more Polkadot dynamics on the price chart.
See the list of crypto losers to find unexpected opportunities.
See the list of crypto losers to find unexpected opportunities.
The current circulating supply of Polkadot (DOT) is 1.60 B USD. To get a wider picture you can check out our list of coins with the highest circulating supply, as well as the ones with the lowest number of tokens in circulation.
The safest choice when buying DOT is to go to a well-known crypto exchange. Some of the popular names are Binance, Coinbase, Kraken. But you'll have to find a reliable broker and create an account first. You can trade DOT right from TradingView charts — just choose a broker and connect to your account.
Crypto markets are famous for their volatility, so one should study all the available stats before adding crypto assets to their portfolio. Very often it's technical analysis that comes in handy. We prepared technical ratings for Polkadot (DOT): today its technical analysis shows the sell signal, and according to the 1 week rating DOT shows the sell signal. And you'd better dig deeper and study 1 month rating too — it's sell. Find inspiration in Polkadot trading ideas and keep track of what's moving crypto markets with our crypto news feed.
Polkadot (DOT) is just as reliable as any other crypto asset — this corner of the world market is highly volatile. Today, for instance, Polkadot is estimated as 2.74% volatile. The only thing it means is that you must prepare and examine all available information before making a decision. And if you're not sure about Polkadot, you can find more inspiration in our curated watchlists.
You can discuss Polkadot (DOT) with other users in our public chats, Minds or in the comments to Ideas.