AVAXUSD at Support ? recent brok the resistanceAVAX has recently broken the Support and is likely to reverse from this support area let us see.
DOTUSD.P trade ideas

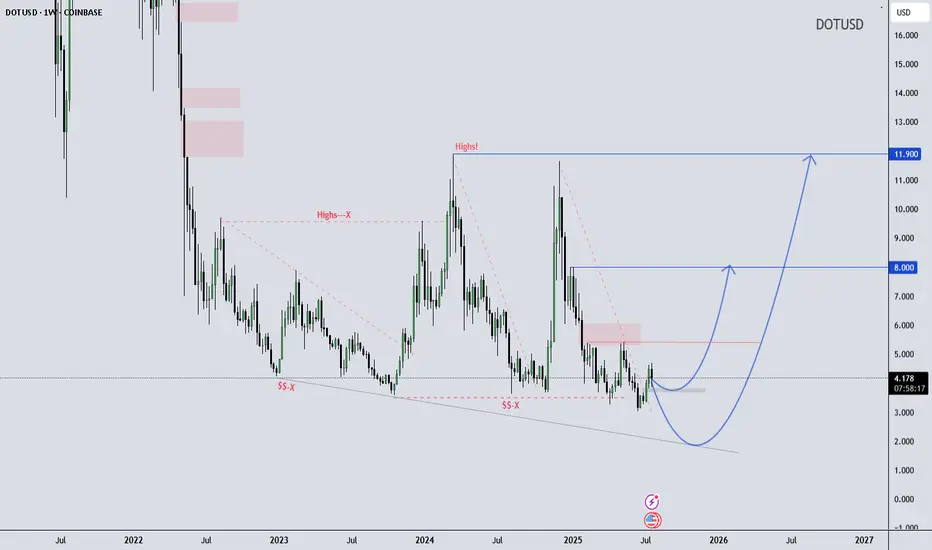
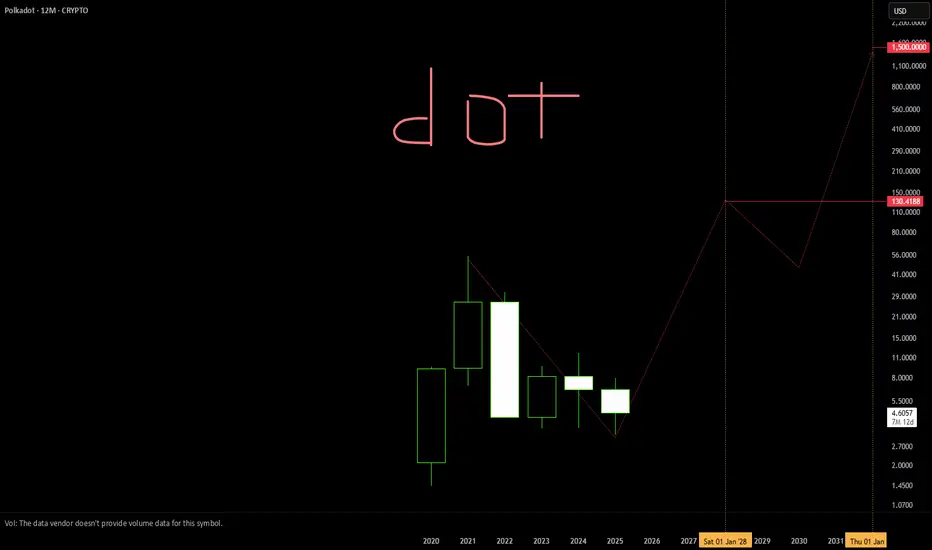
DOT/USD Weekly Structure - - Reversal Possibility Developing DOT/USD Weekly Outlook – Educational Perspective
Polkadot (DOT) is trading near the lower boundary of a long-term falling wedge structure, showing early signs of stabilization around the $4.20 support zone. Price has respected this level multiple times, potentially forming a rounded bottom, which often suggests shifting momentum.
If the structure holds, it may continue developing a macro reversal pattern. This kind of formation is typically monitored by swing traders looking for high risk-reward setups in longer timeframes.
Key Technical Levels to Watch:
$8.00 – Mid-range structural resistance
$11.90 – Historical supply / macro pivot zone
This chart is shared for educational purposes only to support market structure learning. Always follow your own analysis and risk management plan.
Wave Trader Pro
Learn & Earn
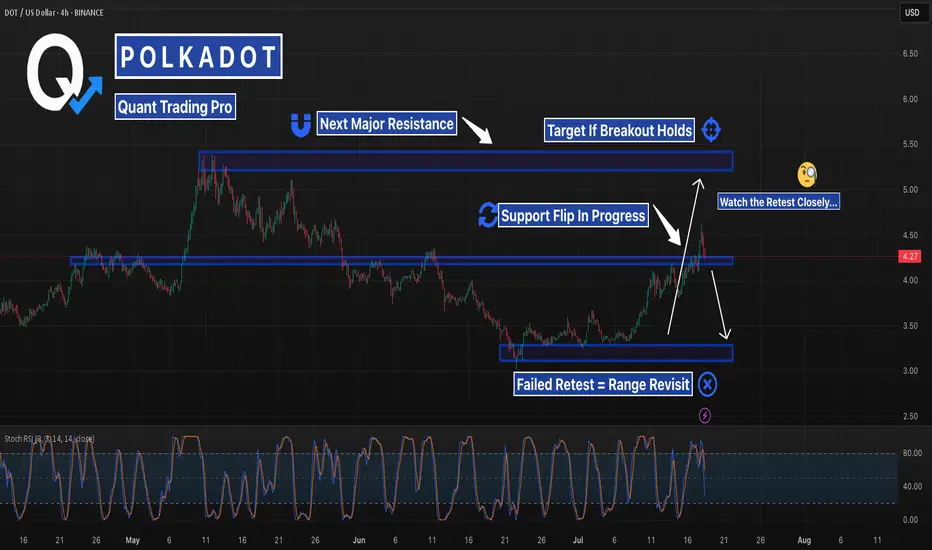
DOT Mid-Level Retest — Setup for the Next LegDOT is testing a key breakout level that previously capped the rally. If buyers defend this zone, the next major target sits around $5.50 — but failure here could send it back into range. High reward, high risk setup forming.
DOTUSD – Bottom Bounce or Trap?DOT dropped hard through $4.13 and 200 SMA but found strong buyers near $3.91. It’s now rebounding with decent RSI momentum, pushing toward $4.08. If this strength holds and price breaks $4.09, a move to $4.13 is possible. But failure to reclaim $4.09 might cap this as just a lower high.

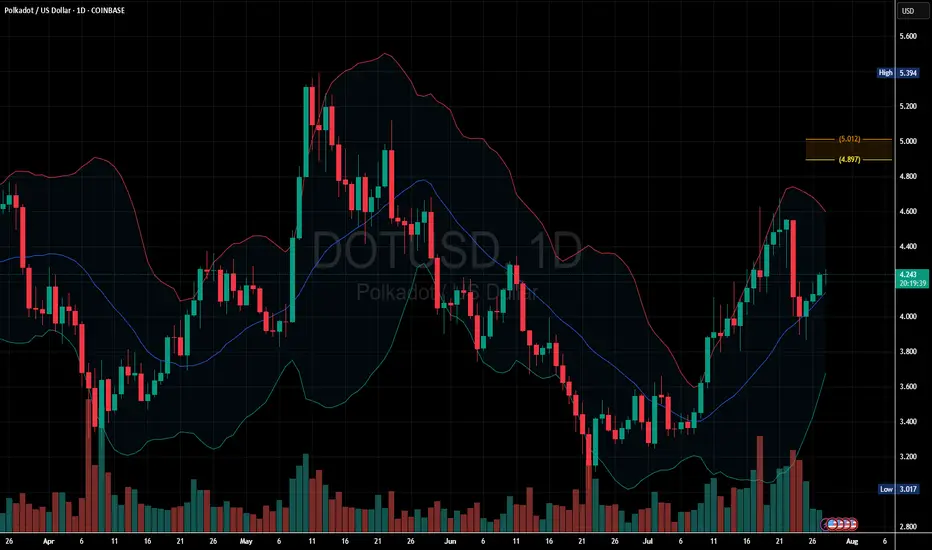
Polkadot Daily Chart: Uptrend Continues Above Mid-Band Support
DOT is trading above the 20-day moving average (middle band of the Bollinger Bands), which is a bullish signal suggesting upward momentum.
If price holds above the middle Bollinger Band, the bullish bias remains intact.
A close below it could weaken the short-term bullish case.
Key support: $4.20–$4.00
Key resistance: $4.60 (break above confirms continuation)
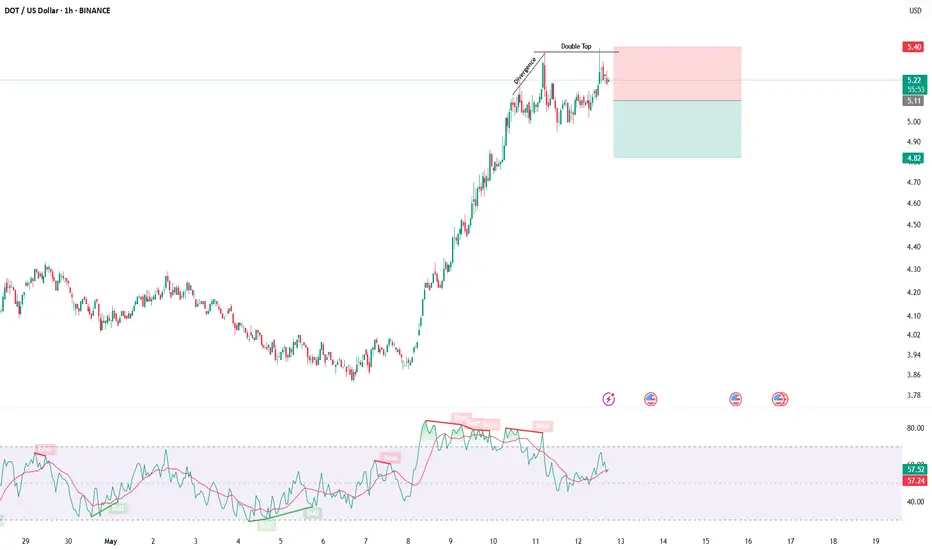
DOTUSD – Trendline Break Retested | Breakout or Trap?Polkadot broke its multi-week descending trendline and reclaimed support, but now faces resistance just above $4.20.
With a clean structure retest and rising momentum, this becomes a classic breakout-or-fakeout setup.
Measured move points to $5.40 if it runs.
Invalidation sends us back to $3.60.
#DOTUSD #Polkadot #SupportResistance #BreakoutTrading #TrendlineBreak #QuantTradingPro #TradingView

SHORT DOTUSDT.P - KrakenLimit Order Set-Up
Entry: 4.058
Take Profit (TP): 3.691
Stop Loss (SL): 4.091
Market Context:
Price is slowly retracing into a Fair Value Gap (FVG) / imbalance zone. However, Open Interest (OI) is decreasing across all derivatives exchanges, while price is climbing — a classic sign of a weak upward move. This suggests that the upward price action is likely driven by shorts closing their positions, not fresh long interest entering the market.
Technical Confluence:
This setup aligns with the golden pocket retracement zone (Fib 0.618–0.65), adding further weight to the potential reversal.
Note:
This move lacks strong momentum and shows signs of exhaustion. Proceed with caution and ensure strict risk management is in place. The trade setup is highly context-dependent, and conditions may shift rapidly.

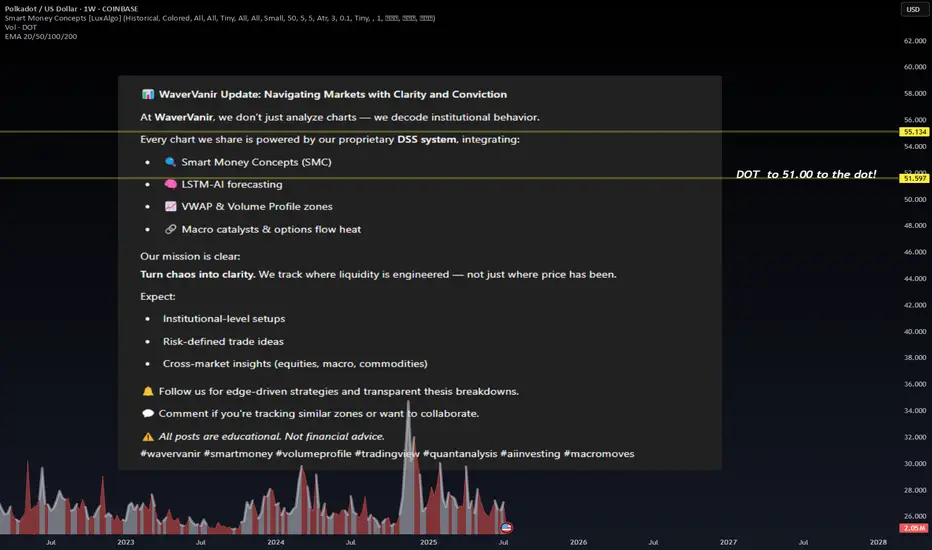
WaverVanir Update: Navigating Markets with Clarity and Convictio📊 WaverVanir Update: Navigating Markets with Clarity and Conviction
At WaverVanir, we don’t just analyze charts — we decode institutional behavior.
Every chart we share is powered by our proprietary DSS system, integrating:
🔍 Smart Money Concepts (SMC)
🧠 LSTM-AI forecasting
📈 VWAP & Volume Profile zones
🔗 Macro catalysts & options flow heat
Our mission is clear:
Turn chaos into clarity. We track where liquidity is engineered — not just where price has been.
Expect:
Institutional-level setups
Risk-defined trade ideas
Cross-market insights (equities, macro, commodities)
🔔 Follow us for edge-driven strategies and transparent thesis breakdowns.
💬 Comment if you're tracking similar zones or want to collaborate.
⚠️ All posts are educational. Not financial advice.
#wavervanir #smartmoney #volumeprofile #tradingview #quantanalysis #aiinvesting #macromoves
DOTUSD – Power Push, Fuel Still in TankDOT exploded from $3.65 and surged through resistance zones to reach $4.18. After a mid-range correction, buyers reloaded with a clean breakout past $4.08. Now pressing into previous local highs. This is a momentum continuation setup unless $4.12 breaks down.
Wyckoff Pattern- To understand trading at its core, you need to understand the Wyckoff Theory.
- Everything you need is in the chart and yes, it's simple and might look like copy-paste, but it's pure Wyckoff.
- Remember this post i made in 2021 ? check it again :
Remember, trading is like a washing machine, it shakes you up, spins you around, and pressures you to sell when you should be buying or Holding.
Not a price prediction, just a smarter way to level up your strategy.
Happy Tr4Ding !

Polkadot: Bottom Already in?Given Polkadot’s recent sharp rebound toward resistance at $3.66, we consider it 35% likely that magenta wave alt. has already bottomed at $3.02. This would be confirmed by a meaningful breakout above said $3.66 level. Our primary scenario, however, still calls for lower lows as part of wave – with a break below the same $3.02 support.
📈 Over 190 precise analyses, clear entry points, and defined Target Zones - that's what we do.

Dot have potential to catch move like EthereumBullish trend making HH may go down for HL
Rsi divergence
Reversal pattern falling wedge
Manage your risk before entering position in real account.

DOT -time to bounce?DOT is at critical S/R range. I would like to see it bounce asap as we are at RSI diagonal support line with bull divergence. However it looks weak so scam dump is possible - that would not be over for DOT as then it would be doing same pattern AIOZ did before reversing.
No matter which path it chooses I expect eventually test of fibb 0.886 range pivot.

Polkadot (DOTUSD) is getting closer to a scary levelPolkadot ( MARKETSCOM:DOTUSD ) is coming closer to the current lowest point of this year. If it surpasses that area, then this would place the crypto in the area, last seen five years ago, bringing it closer to inception price.
Let's dig in...
CRYPTO:DOTUSD
Let us know what you think in the comments below.
Thank you.
77.3% of retail investor accounts lose money when trading CFDs with this provider. You should consider whether you understand how CFDs work and whether you can afford to take the high risk of losing your money. Past performance is not necessarily indicative of future results. The value of investments may fall as well as rise and the investor may not get back the amount initially invested. This content is not intended for nor applicable to residents of the UK. Cryptocurrency CFDs and spread bets are restricted in the UK for all retail clients.

DOT 40% gain in 30 DaysIf the price of Bitcoin shows a positive reversal from $106k and maintains above $110k, the DOT price is expected to break above its local resistance of $4.40 and record another local high .
Read more here: www.cointrust.com

It's worth entering into the deal...In my opinion, this cryptocurrency is one of the good cryptocurrencies in the market, which is now in a good area for buying.
Put it on your watch list and if you get confirmation, make your transaction according to your risk management.
I hope you have used the analysis well.
Follow our page to see more analysis.

DOTUSDAlligator Strategy Buy Call
Risk Rewar TP 1 1:1 and T2 1:3
Open Two trades one for TP1 other for TP2.
For TP 2 make sure to move your SL to Entry point once price crosses TP1. So that you can ride Tp2 with zero loss.

DOTUSD📊 30m Analysis – DOTUSD
Strategy: 🐊 Alligator Strategy
Trend: 📈 Strong Uptrend
📝 Trade Plan
🎯 Entry Point (EP): 4.603
🛡️ Stop Loss (SL): 4.530
💰 Take Profit 1 (TP1): 4.680
💰 Take Profit 1 (TP1):4.75
Risk Reward 1:1 TP1
Risk Reward 1:2 TP2

dot: $4.59 | My Precious it's the thing that links the thing that runs the thing of everything
this could be the one to rule em all
strategy: own it as overnight success may happen come 2027-2028
tactic: get volume when it dumps or reset
An example of smart money conceptPrice has to tap into the origin of the BOS in order to enter a position.

DOTUSD – 1D Bullish Setup in Play | Swing Target $11DOTUSD – 1D Bullish Setup in Play | Swing Target $11 💥📈
What’s up crypto traders 👋
DOT (Polkadot) is starting to turn heads on the daily chart with a bullish structure that looks ready for a bigger move. The market's been in accumulation mode, but the signs are pointing toward an upcoming breakout — let’s break it down.
🧠 Bullish Structure Forming
After a long consolidation, DOTUSD is showing higher lows, and the recent price action is pushing against resistance with increasing momentum. This kind of behavior is typical before a major breakout.
Momentum indicators (RSI, MACD) are showing strength. Volume is starting to pick up, and price is holding above key EMAs. That’s exactly the kind of quiet buildup that often precedes explosive moves in altcoins.
🎯 Targeting $11 – Swing Setup
The medium-term structure suggests that DOT has room to run — $11 is the clean target, lining up with previous supply and structural resistance.
📍 Entry: From current price levels (already positioned)
❌ Stop Loss: $3 — wide, but protects against shakeouts and gives the trade space
✅ Target: $11 — aligns with swing structure and market memory zones
That’s a strong R:R profile if this plays out — worth the patience if you’re playing the daily chart.
⚠️ Risk Consideration
This is a high-timeframe swing, not a scalp.
Requires patience and clear conviction — no chasing.
SL is deep, so position sizing is key. Risk what fits your plan, not what looks good on paper.
📌 DOT Looks Ready to Move – Are You Positioned?
Are you in on DOT or still waiting for confirmation? Let me know your view — bullish continuation or another trap?
#DOTUSD #Polkadot #CryptoTrading #Altcoins #SwingTrade #BullishSetup #1DChart #PriceAction #SmartMoney #CryptoAnalysis

$DOT is showing bullish momentum. What do you think?DOT is looking good and printing reversal patterns. Need other technical reasons to buy Polkadot? check this out:
* Enhanced Interoperability via XCM
* Scalability through Parachains
* Shared Security Model
* Advanced Governance System (OpenGov)
* Parachain Auctions and Ecosystem Growth
BINANCE:DOTUSDT
