DOTUSD ❕ trading in rangePolkadot is trading within a range.
The price has reached the lower boundary.
Volumes and volatility decreased.
I expect that the price will grow after fixing above the resistance level.
DOTUSD.P trade ideas


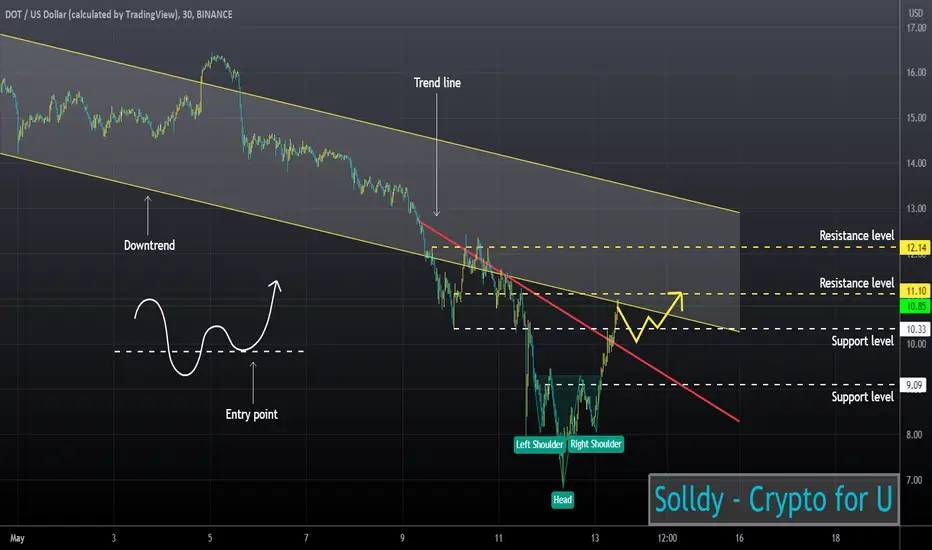
Polkadot Higher Time Frame Bullish Outlook
Hello traders:
Also on watch for the week ahead is DOT.
Majority of the bigger cap coins are developing similar across the market.
Here on DOT, we can see the higher time frame has formed into a nice expanding structure, correcting for the previous impulse move.
The latest development has shown price hit the previous lows, potential double bottoms.
Last few couple days have shown bearish price has slow down, and momentum could be exhausted.
To confirm the upside for entry, wait for some lower time frame bullish reversal price action at the bottom of the higher time frame structure. This could kick off the next bull run if it is confirmed.

DotusdWaiting for lows(liquidity) to get taken out, leading to a reversal into bullish price action. In correlation with Btc, which has Dominance over the crypto market( BTC sub 20,000$).
Keep it simple

#kava kavausd in 1h time framethis chart is for 1hour kava price and we can see that the price is consolidated near the support zone and it is under pressure of a dynamic resistance trend line.
if the bars can break the trend line and the correction leg (simulated bars) retest the support zone, we can set a long position !#kava
#kavausd
time frame : 1h
Ep: 9.80
Sl ~ 9.41
Tp ~ 11.50

#dotusdt in 1h time framethis chart is for 1hour kava price and we can see that the price is consolidated near the support zone and it is under pressure of a dynamic resistance trend line .
if the bars can break the trend line and the correction leg (simulated bars) retest the support zone , we can set a long position !#kava
#dot
#dotusdt
#dotusd
time frame : 1h
Ep: 9.80
Sl ~ 9.41
Tp ~ 11.50

DOTUSD ❕ between levelsPolkadot moves between levels.
DOT has broken up 200MA on the 30m Timeframe.
Trading volumes and long candlestick shadows show interest in price growth.
I expect the price to fix above the support level and then continue to rise.

What do you think?Let's try
I have below the reference link, which is mine too.
I did it first on CMC and was like "Hey why not post it on TradingView while we're at it"
And here I am now :'D

DOT 4h shortSetup: Dot is bearish on both the 1 h and 4 h timeframe. It shows signs of constantly getting rejected by the POC which is confluent with the 50 EMA. Furthermore, it is currently ranging but the OBV is making a lower low, signifying a divergence.
Entry: 10.096
SL: Trail using the SAR( currently at 11.486 which is above the POC)
TP: 6

DOTUSD ❕ ascending wedgeAfter the downtrend Polkadot formed an ascending wedge.
Volatility has declined.
Price is near 200MA on the 30m Timeframe, under the liquidity zone.
I expect price to continue falling to the target shown on the chart after it has fixed under the liquidity zone.

DOT Bear TrapDOT broke the lower lows of summer 2021 with large volume.
Appears that was a trap. DOT needs to breakout of the wedge and clear $19 for the next run up.
Indicators are oversold.
Good Luck

Polkadot: Taking a HeaderSplash! Polkadot has taken a header into our blue trading area, a shape we generally use to mark long-term entry opportunities in our chart analyses. As soon as the altcoin has finished wave ii in magenta there, we expect it to move upwards. Once it has climbed above the resistance at $22.50, Polkadot should have enough drive to make it above the next mark at $50.55 as well.

DOTUSD ❕ lower boundary of channelAfter the formation of the pattern head and shoulders, Polkadot rebounded.
During the rise, the DOT broke up the downtrend line.
Price is rising on rising volumes.
At 30m Timeframe above 200MA, at 1H Timeframe above 100MA.
50MA breaks through 100MA on 30m Timeframe.
Price is at the lower boundary of the descending channel, and stochastic RSI is overbought on 30m Timeframe.
I expect price may go down to retest the support level, but once it fixes above it, it will rise to the resistance level.

What problems is DOT solving that cant be solved with BTCWhat problems is Polkadot solving that can`t be solved on the Bitcoin blockchain and network? Even the most serious altcoins are overvalued and will never see any application for solving real-life problems in production. A close below $26 could create an ugly scenario for people invested in this token. Called the $25 support when the rising wedge broke out on 12-nov, but it looks like this is a short stop to the next support level.

DOT again as we know...!!!
Check out my previous analysis. it is on his way in accordance with his movements as we want.
thans.

DOTUSD ❕ downward wedgePolkadot came out of the descending channel.
Volatility and trading volumes have decreased, and the current price movement looks like the formation of a downward wedge.
Buyback of the price under the support level happened on the candlesticks with long shadows.
I expect that the price can reach the resistance level if it fixes above the support level. It is important to watch the price reaction to the trend line.

DOT : Set upGlobal view for long
(Watchlist)
.
wait for candle to break out the orange channel to enter

Polkadot Polkadot
Only one step left, Polkadot came to the edge of the abyss.
Polkadot, as part of a downward up-trend on D-1, has fallen to critical lows since early April and approached its historical key support at $12.00, breaking through which risks losing investment interest and, as a result, its liquidity and recovery potential in the short term. The level of $13.00 is not only the middle of the channel and intermediate local support for the downward dynamics, this level may well be a good start for a test of the channel trendline breakout, followed by an attempt to restore its liquidity as part of medium-term purchases. The support level of $12.00 is critical and in case of its breakdown, Polkadot risks updating the historical low of $10.00 per coin.


DOTUSD analysis Euphoria High and depressions low Full breakdown how i find my euphoria and Depressions

DOT - THIRD LEG DOWN IN PLAY?
We have really long consolidaion on crypto markets. We can see a half year long wedge on DOT. Falling wedges love to be touched three times on the downside line ;) Third leg down also would mean we are going down from curent range sarted at the begginig of the year, so move down should be huge, 25-30% at least towards 10/11 usd. For now test of 16 is possible.

Falling Wedge on all Crypto... Just gonna put the DOT chart up..Everyone's looking at this... Self fufilling? Probably. PTs @ .618($34~), 1($50), & 2.618 ($120s~)
I'm a buyer at these levels
