PolkadotAreas of interest for buys on Polkadot. If weekly low gets wiped out next region for buys would be around the 7$ region. target: previus all time highs.
DOTUSD.P trade ideas

Bullish Crab Looking For Bids to the UpsideWe have a double bottom here at the pcz after reaching oversold multiple times this my be the indication of a temporary bottom.

DOTUSD 2D: 1000%+ gains THE BEST Level to BUY/HOLD (SL/TP)(NEW)Why get subbed to me on Tradingview?
-TOP author on TradingView
-2000+ ideas published
-15+ years experience in markets
-Professional chart break downs
-Supply/Demand Zones
-TD9 counts / combo review
-Key S/R levels
-No junk on my charts
-Frequent updates
-Covering FX/crypto/US stocks
-before/after analysis
-24/7 uptime so constant updates
🎁Please hit the like button and
🎁Leave a comment to support our team!
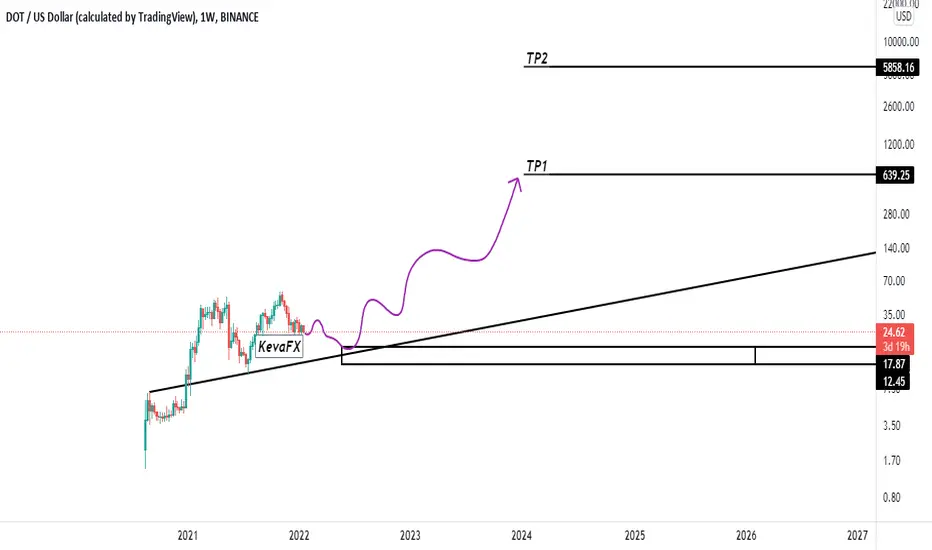
DOTUSD 2D: 1000%+ gains THE BEST Level to BUY/HOLD (SL/TP)(NEW)
IMPORTANT NOTE: speculative setup. do your own
due dill. use STOP LOSS. don't overleverage.
IMPORTANT NOTE: read entire idea before
execution. Tagged as BULLISH because I expect
reversal once we hit 8/9 USD.
🔸 Summary and potential trade setup
::: DOTUSD D2 chart review
::: chart looks good /strong
::: setup still valid as of right now
::: previously massive BULL TRAP after
::: FAILURE to break CYCLE HIGH
::: get ready to BUY LOW later
::: expecting BEAR TRAP near 8/9USD
::: i.e. FAKE BREAKDOWN of key S/R
::: best reload bulls near 8/9USD later
::: expecting 1000% bull run
::: re-test of sliding S/R line
::: near 100 USD later
::: BULLS stay out be ready later
::: expecting short-term correction
::: BULLS get ready to BUY after CORRECTION
::: TP bulls is +1000% gains later
::: expecting decent gains soon
::: 40-55% pullback short-term
::: recommended strategy: BUY/HOLD after CORRECTION
::: TP BULLS +1000% gains / 25 USD
::: BEST reload BULLS near 8-9 USD
::: TP BULLS is 100 USD final EXIT
::: SWING TRADE: BUY/HOLD IT
::: bull run not over yet
::: good luck traders!
::: BUY/HOLD and get paid. period.
🔸 Supply/Demand Zones
::: N/A
::: N/A
🔸 Other noteworthy technicals/fundies
::: TD9 /Combo update: N/A
::: Sentiment mid-term: BULLS
::: Sentiment short-term: BEARS/PULLBACK
RISK DISCLAIMER:
Trading Crypto, Futures , Forex, CFDs and Stocks involves a risk of loss.
Please consider carefully if such trading is appropriate for you.
Past performance is not indicative of future results.
Always limit your leverage and use tight stop loss.

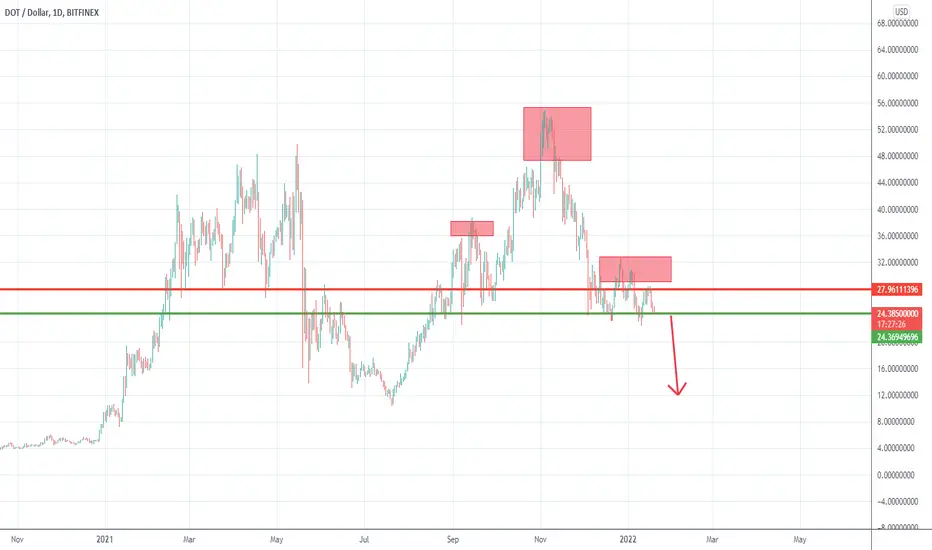
DOT Exchange Trading Idea 22-01-23DOT is at the 83.5% level. If the rest of the market continues to go down, then DOT may see $15. Still not ready to jump in. I would wait for a breakout and retest of the top of this 78.6% zone before it's interesting.

DOTUSD Fail To Continue After ATH, Reversal Possible
Hello traders:
Similar like ETH, we can see DOT's price has reach ATH, but did not continue upwards after.
Instead, we see a potential double tops, and a Head and Shoulder developing. Good signs of bearish reversal possibility.
Wait for the right shoulder to develop, as a bearish continuation correction on the lower time frame,
that can be the confirmation to enter if price develops into the right price action.
Thank you

dot where to goafter dot break the channel, we expect that godown to the next line of the channel
now we are in a pullback
after that touch the above field line
then start to godown

DOTDOT is getting closer to the July-2021 bottom.
Do not go all in, Always try to apply cost averaging strategy.
Not Financial Advise

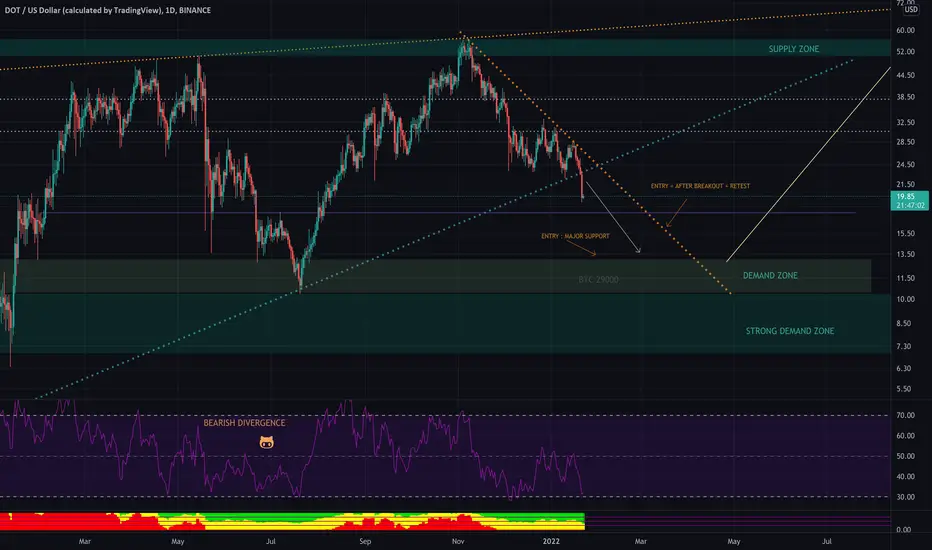
DOT : UPDATEDNow all the coins that I just updated RSI is a bit oversold
so it may bounce back to test the previous support
if not pass then it will fall down to the target as above (if BTC goes 29000)
.
Trade safe & fun
Mil
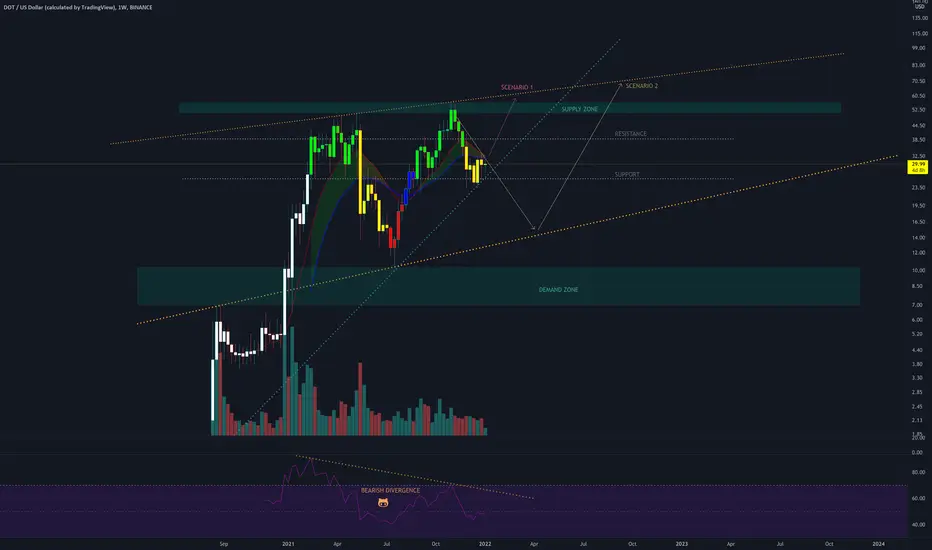
#DOTUSD #Polkadot Target 65$I estimate 2 different path for Polkadot.
I think before new ATH we will test long term support line. But according to BTC moves, it might be now or after H&S formation.
One way or another it doesn't matter at final I believe we will see 65$ within 6 months.


DOT on correction railAfter a long bull run, Dot needs to get some rest and refuel. 12-15 will be a good area for the end of correction.
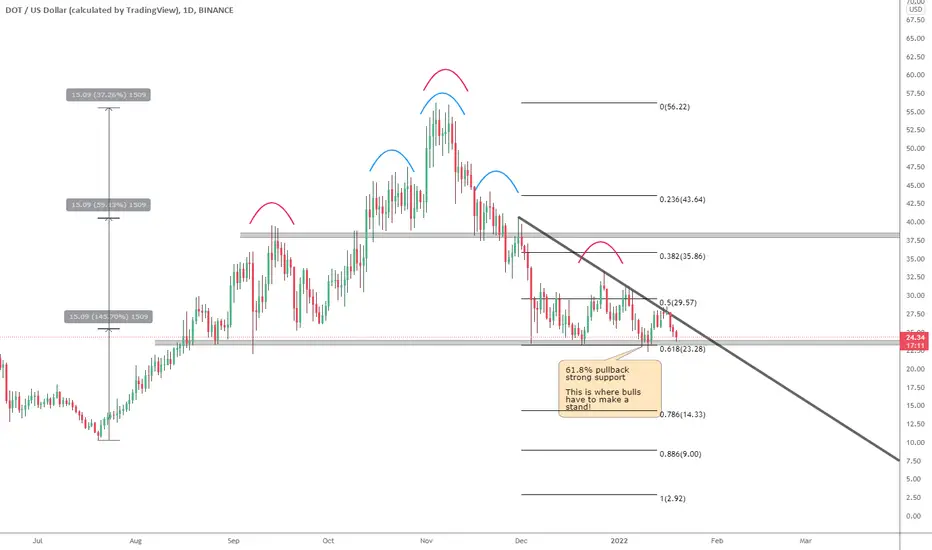
DOT - It´s so symmetrical!DOT´s chart is so symmetrical that it almost looks fake.
The uptrend from July/21 can be divided in 3 almost identical parts with a strong resistance/support level between each one of them.
We also have a small head and shoulders (H&S) pattern (blue) that was broken took us from one level to the next one.
Now, we´re testing the neckline of a larger H&S pattern (red). Breaking this could be disastrous and take us down to the low 10´s (or not so disastrous if you´re a futures trader and take a short leveraged trade).
Since this is also 61.8% pullback from the whole DOT lifecycle, this could be a tough one for bears to crack. The black trendline is key for bulls. I won´t take any trades until support or trendline are broken.
Dot can lose half of its valueLike a lot of coins, Dot is not feeling good as well
After a run that started in July and ended with a new ATH in first days of November, Dot has started to roll back and now is trading exactly in the horizontal support
The price action from September by now can be also viewed as a large H&S and a break under the neck-line could accelerate losses.
If the selling pressure in the crypto market continues, I would net be surprised for this coin to drop to 10-12 support zone.
Only price back above 32 would put a pause to this bearish scenario.
DOT is pumping very soon#Polkadot $DOT 4 hour analysis:
#DOT is in a beautiful 4hour falling wedge with a target of $28-$30
It’s also oversold on the 1-4 hrs.

DOT - My Trading Plan in 5 mins!Hello everyone, if you like the idea, do not forget to support with a like and follow.
Here is the top-down analysis for DOT, feel free to request any pair/instrument or ask any questions in the comment section below.
Best of luck!

DOT Harmonic Idea ?Looking at DOT and i am seeing a bullish crab on the one hour.
Please keep in mind i am still learning harmonics as well as trading.
I will look for a buy in the purple area.
DCA into the purple if you wish.
Buy order is placed at 22.315 with my stop loss below the red area. ( for me personally )
Would look to take profit in the white areas.
This most likely will not play out if bitty dumps.
Always look for divergences in the purple area as this may signal an entry and trend reversal.
( i dont use ftx i use phemex but trading view does not have a chart for dotperp on phemex....
www.tradingview.com


One of largest Metaverse Projects on PolkaDot: Bit.CountryJust a quick fundamental update on DOT - one of 2022's top Metaverse projects that is in early access mode and has a parachain slot on kusama already is on PolkaDot!
The PolkaDot ecocystem is going to grow exponentially in 2022 and it will be led by all sorts of projects from DeFi, to computational data layers, to gaming / metaverse / P2Es and NFTs. This is a longer term bullish catalyst for DOT and its massively growing ecosystem. Bit.Country is already in early access mode and will have some much larger announcements in coming days... typically when there is no news at all and sentiment is low, it's a good idea to accumulate before the major rush of investors come swooning in.
bit.country

DOT Downside Risk (Polkadot)Polkadot is one of those cryptocurrencies that piqued my interest this past bull market. Unfortunately, the online community is already becoming a ghost town, after the project appeared suddenly in the top 10 by market cap. Many cryptocurrencies are breaking down from their bull market uptrends, but DOT is still above. Should the support fall, I think DOT can eventually head back below $10. Depending on what's going on with the project and ecosystem at that point, I may purchase some at those prices.
Let's see! On the upside, if it holds the uptrend, DOT can test the top of the channel once more. This is not meant as financial advice - this is meant for speculation and entertainment only.
-Victor Cobra

Polkadot shortPolkadot bounced off the resistance level. Asset broke trough the ascending trendline. Bearish movement to resistance level at 23.1 is possible.

DOTUSD longIn addition to bitcoin, other assets that generated a significant share of the payments BitPay processed in 2021 included ethereum (ETH), with a 15% stake, and stablecoins, which generated a total of 13%. The increased popularity of stablecoins in crypto payments is partly due to the fact that more businesses have started to use them for cross-border payments.
From cryptonews.com
The demand for altcoins is increasing, both among large companies and private users.
Therefore, we can assume that DOT will push back from support and go up. There are two possibilities:
1. a rebound from support at 25.80
2. a rebound from strong support at 23.90.
After this bounce, I will look for buying opportunities for this instrument

DOT : Up now or fall further down ? Everything depends on the overall market - BTC/ETH still.
it can go up because RSI still not overbought
and also can go down (more possibility) with bearish divergence
.
I'm buying the coin so I did the analysis.. but this one is still on decision..
I may DCA it . or wait for some more confirmation signals
.
Trade safe, always place the stop loss
Feel free to feedback/ comment
Mil