DOTUSD - A Long Term Look At This Giant WedgeIn my previous looks at DOTUSD, I drew the dominant long-term pattern as an ascending channel with arcs up and down the channel.
Here I look at another possible dominant pattern: The giant wedge that has been forming since it was listed on Kraken, the first major US exchange to list it and have significant trading volume.
We see a few things looking at the pattern from this perspective. First, there is a nicely formed wedge pattern with well-established resistance around $55, and a well-established ascending support line that now gives support at $19.
$19 has also been a key resistance and support throughout DOT's history, as I highlighted (to the best of my limited ability) with some red circles. I'd expect this to be an extremely strong support level, limiting our likely downside from here.
Of course, if $19 breaks, it's probably time to cash out and wait.
If the price bounces as expected and follows the current green arc up, within a short time it will hit the resistance around $55.
If it can manage to break past that level, the price will easily get to $100 and beyond.
If that pattern plays out, expect resistance and downside when we intersect the previously formed red arc, and as it approaches $55, and then probably a backtest to that level as support.
Good luck and enjoy.
DOTUSD.P trade ideas

DOT Wake up you broke the trend lineDOT Has finally jumped to the other side of the trendline.
And finding resistance on RED long term support.
As soon as that line is cleared, DOT should advance to the fib level just under $33
Good Luck

Polkadot: Wintertime!With the recent crossing of the support line at $25.32, Polkadot is making a clear statement that it takes the correction seriously! After hitting the area between $10.81 and $5.71, the course should then rise again and surge past the $50 mark.
Got all your presents already?

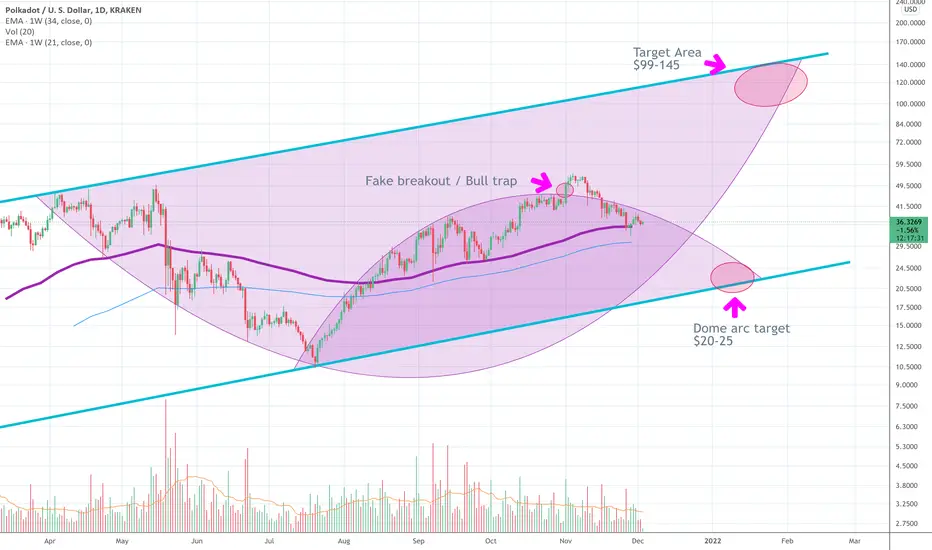
DOTUSD - Update to Long-Term Channel with Battling ArcsAfter the initial breakout from the smaller bearish dome, I felt confident that the bullish arc would play out and take DOT to $95+ by year end.
But alas... it was a false breakout! The parachain auctions didn't pump the price nearly as much as expected, and left a lot of us DOT hodlers scratching our heads.
Looks like everyone wishing to participate in crowd loans had seen the auctions coming way ahead of time and filled their bags early.
The upward parabolic scenario was invalidated, and the price dropped right back into the bearish dome arc, continuing its path down along the arc wall.
This arc is threatening to take the price all the way back to the base support line as low as $20.
In this updated chart, I stretch the bullish arc out as far as possible, using daily closes and ignoring the wicks.
Drawing it that way can get us to about December 22 at the latest before one of the arcs must break and we know which way DOT is heading in the mid-term.
Will moonbeam, acala, and the other parachain winners bring a flood of new users to Polkadot after launching on December 17th, or will it completely flop as even more market momentum goes to ETH and SOL?
Let's see. My opinion is that there's a better chance of break upwards if the broader market stays bullish.
Even Litecoin had its time to shine this cycle, and Polkadot has a way better chance for actual adoption and broad use. Its day to pump will come!
I'm betting the $100+ scenario plays out.
Good luck and have fun.
Dotusd $8dotusd is sliding to the bearish hole, this set up may take couple weeks but $8 is strong support and will expect bounce from there.

dot price predictiondon't miss this buying target
buy zone
20$
16$
sell target and take profit
35$
44$
52$

PolkaDot for long term
PolkaDot is heading down to the trend line. Waiting for the confirmation of support. Likely it'd form an ascending triangle for going long.
Happy trading!

Dot ideaTech idea :
Thesis : Running Flat (ABC Family Correction 3-3-5)
Wave A - Zig zag correction
Wave B - Zig Zag correction
Wave C - 5 wave (Meant to put 5 wave in the post not Zig-Zag)
Wave 2- Zig-zag correction /// Style: Sharp
Wave 2 - 0.786x of wave 1 (Deep)
Wave 3 - 2.618x-3x Wave 1 (Extended)
Wave 4 - Expanded Flat /// Style : Sideways
Wave 4- 0.382x wave 3 (Shallow)
Wave 5 (Projection TBD) - 1.618x
Strengths : Waves 2 and 4 alternate with "Depths of Retraces" and alternate
with "Sharp/Sideways style corrections" /// Volume starting to decline
showing Wave 5 signals
Weaknesses : Parallel channel is out of sorts , Wave 5 and Wave 3
could be said as both being extensions
Summary : I would like to see this "Ending diagonal" meet the Minimal
retrace to "$31.51" and I want to see a
"Impulse" in (Wave personality) and increasing "Buying pressure" while also breaking (VPOC Line) ///
I don't want to see this 5th wave of the ending diagonal invalidating at the
"1 extension" below at the converging trendlines

Polka DOT reaccumulationAll eyes on DOT after launching parachains. If we can break trading line up 70 usd is possible in nearest future. Otherwise 19 usd on lower lt in game.

DOT/USD - Ready to resume the main trend?Hello traders and investors,
The long waiting game for DOT/USD seems to be still intact. In my count, I consider the current correction, primary 2 for a long long cycle. Of course, having a cycle with primary pink 3 at $1089 can be a dream (for some) and just a matter of time (for others).
The current idea will be invalidated either if the price falls below $10.26 or the market will start a long consolidation without breaking the top $54 with a convincing strong increase volume.
Let's see

Polkadot Price PredictionDOT has edged lower after pulling back from Thursday’s high of 27.79. The altcoin has been on a downtrend since early November when it hit its all-time high at 55.28.
Currently, Polkadot's price was down by 3.77% at 25.35. On a four-hour chart, it is trading below the 25 and 50-day exponential moving averages. It is also below the long-term 200-day EMA.
In the short term, I expect the crypto to remain under pressure. It may trade within a horizontal channel between the week’s low of 24.17 and the 50-day EMA at 26.80709039. Below the range’s lower border, the bears will be eyeing a 5-month low of 20.00.
On the upside, a move above the upper border will likely place the resistance level at 30.02. However, as long as it remains below the 200-day EMA at 32.69, the Polkadot price will remain in a bear market.

Buy DOTUSD AND HOLDBig fall and at the low support seemed strong. This is going to be the big year yet for 2022, target for DOT , is 90$ the highest top is 100$ which will be huge.
It’s not too late to buy it ; y’all should get in as hold it if you have coinbase please do the same.
Good luck y’all and happy holidays

Updated Polkadot 2022 Expectation$DOT with parachain auctions & project implementations leading to 4x from $25 to $100.
There will be peak & valley candle wicks... price targets and growth will be consistently met.
Expecting this to move counter to overarching economic downturn.


Polkadot Future is BrightFast update.
- Let me be clear on Polkadot, we didn't break any up trend while BTC was dipping.
- As you can see on the Graph DOT bounced on his trend (White Line) ( Actually EMA100 / 1D TF).
- Acala Network Won first Parachain.
- Second Parachain Round just started.
- Don't forget that Polkadot huge ecosystem, not same as Solana (Smaller), it will take more time but the long term finality could be impressive.
- Unless TheKing not fails Polkadot won't dip more, like most of all altcoins.
-----------------------------------------
Trade Plan Unchanged
-----------------------------------------
TP1 : 75$ ish
TP2 : 100$ ish
-----------------------------------------
i will add in comments olders analysis.
Stay S4fe and follow the King!
Happy Tr4Ding !

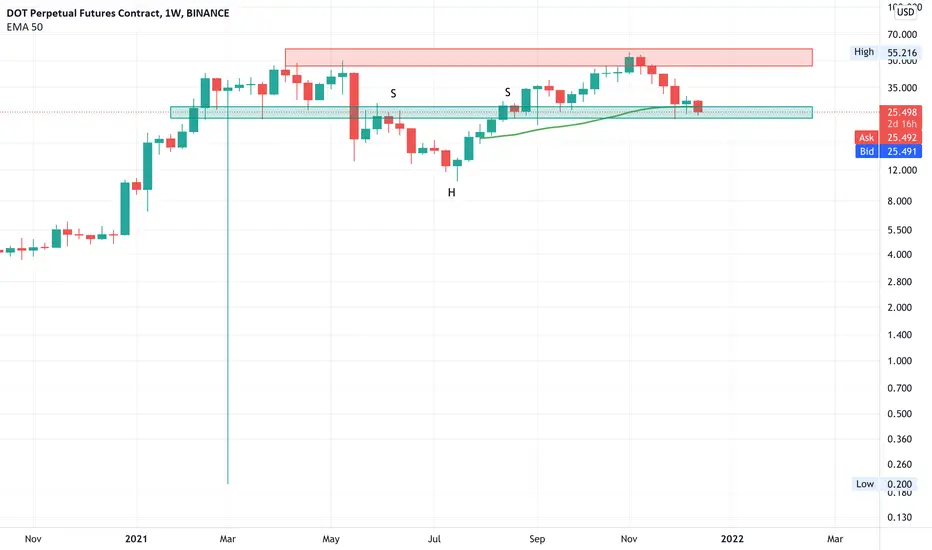
DOTDOT is a now at very significant support. Current market conditions are a bit uncertain so we need to see if this support holds.
If it holds, that would be a nice long opportunity. If we lose the support, we need to see what happens around $20.
Near previous ATH would be the take profit levels we are looking for.
We would like to see a close above the 50 weekly EMA and the support holding to enter a long position.

Bull run for DOTUSDBreaking is occurring so as ETHUSD,BTCUSD,DOGEUSD… other Cryptos as well. Should be expect a breakout for DOTUSD; seemed to be really bullish and playing around a bit, if your a holder ; patient for another big green the support is really strong. I have nothing else to say but good luck and happy holidays

DOT DOUBLE TOPLooks like double top to me.
Price has just fallen under 50ma and fallen beneath key support. Double negative. Unfortunately two negatives does'n't make a right this time.
If price stays under both the moving average and support line of $25 then you can expect to see $15 in the coming weeks.
Hope this helps!

Fractal and fib time on dotWould see us heading lower , taking out the LTF lows and then swing back up again to new aths, would be in line with what i think is going to happen for BTC. Fractal is from the last runup to ATH for dot. Alot of confluence IMO.
Not saying it will play out exactly like this, but IMO its worth keeping an eye at the idea.


DOT Exchange Trading 21-12-12DOT has broken down out of the 50% level twice but the 61.8% seems to be holding pretty well on the daily. For that reason, I am only showing the relevant part of the chart in this image. It does not look like price is going to drop below the $26 level. It has been there twice in the past few days. However, we are looking for a higher high around 31.65 before I would consider buying.

Polkadot´s 5 tasks on the 4h chart (DOT)Polkadot´s 5 tasks on the 4h chart...
1. breakout of the resistances on RSI and OBV
2. flip the MA Ribbon bullish (green)
3. breakout of the red trendline channel
4. break the volume resistance
5. confirm breakout(s) and have fun 😎
Drop me a nice comment if you'd like me to analyze any other cryptocurrency or do another comparison.
*no financial advice
do your own research before investing
