DOTUSD.P trade ideas
Polkadot/USD short trade 4HThe market sentiment has changed to bullish for a small period of time.
So that means I'm looking for sell opportunity's because the price will fall down after a small bullrun like this.
Polkadot is one of the candidates that is reaching a nice supply zone.
So the trade idea is simple I place a limit buy order at the indicated area, and if price is exhausted enough if will fall down very quick.

DOTUSD TRADE IDEAon 1 hour timeframe , i have mapped out the BOS and point of interest. trying to trade with the 1 hour market trend. Long soon..

Dot Value Buy
A spot purchase for DOT holds value for long-term holders here. The 89 SMA (Blue) and 377 SMA (Red) converge soon, while the 34 SMA is the Black MA). The price may go lower, but I see value here for long-term holders. It is hard to predict what the market will do.

Bullish Shark (1.618 Momentum-Extension)Bullish Shark, XABCD Pattern and ABCD Pattern tools, using reciprocal fibonacci extensions

DOT Head and Shoulders Reversal Might Be Confirming Today on the
Polkadot (DOT) might be experiencing a significant trend reversal on the 4-hour timeframe, as a classic Head and Shoulders pattern appears to be nearing confirmation. This pattern suggests that after a bullish trend, DOT could shift into a bearish trend, providing a strategic sell opportunity for traders.

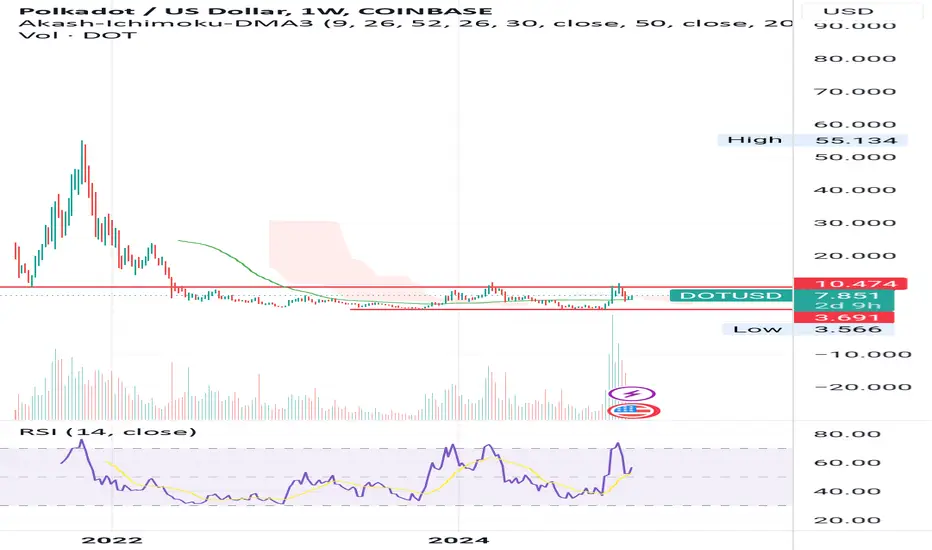
Polkadot: New Yearly High Soon?Polkadot is currently showing a slight downward trend. However, since hitting the pink wave II low at $7.42, the cryptocurrency has made a significant recovery. According to our primary scenario, the ongoing impulsive wave III should push the price well above the $10.52 resistance before the next interim correction in the pink five-wave pattern begins. However, Polkadot is unlikely to surge straight to a new all-time high without experiencing occasional pullbacks along the way. Indeed, there is even a chance for a new low of wave alt. II below $7.42.

DOT on a Dip?When the market pulls back, instead of looking for momentum trades, its best to look for a dip to buy. If this ascending trendline gives up, Dot will probably go sub $6, however, its likely to hold up here, and that makes this right about the best time to enter, if this ascending trendline does hold here.
There are many assets right now that look like this, its worth coming them and looking for good entry, with the caveat that if we break support on any of those, you would need to bail for a small loss and focus on the next support, which is a bit lower for most of these alts.
Also to be fair, orderbooks look not great right now, more traders expect lower prices versus higher prices. I think we are at a point ETH could consolidate here and that could be rough books while it convinces traders it has a footing. You need to be especially vigilant trading right now.

Polkadot RebornAs always, I’ve kept the chart simple and straightforward, so there’s no need for lengthy explanations:
- Bubbles: Red represents resistance, and green indicates support.
- Trends: Clearly marked with blue lines.
- Historical Resistance: Illustrated with violin lines.
Key Notes:
- As I’ve explained before, resistances often flip into supports over time, so in this graphic, i turned red older bubbles to green bubbles. simple as that..
- Like many altcoins, Polkadot (DOT) has broken out and is now showing bullish momentum.
Important Considerations:
- Keep in mind that most altcoins are heavily influenced by BTC, BTC Dominance (BTC.D), and USDT Dominance (USDT.D). To trade effectively, you need to monitor these factors simultaneously.
------------------------------------------------------------------
DOT Support and Resistance Levels:
------------------------------------------------------------------
Support 1: $9.50 (current level)
Support 2: $7.50
Support 3: $5.80
Resistance 1: $23.20
Resistance 2: Approximately $50 (previous 2021 ATH).
------------------------------------------------------------------
Potential Targets for the Next Bull Run:
- The potential incoming alt run targets are aligned with the trend and marked by grey dotted lines, calculated using Fibonacci.
Remember, this is just the beginning, not the end, don’t be fooled.
Happy Tr4Ding !

POLKADOT - Sell Idea (Short-term)The turn around right off the key-level resistance of 11.15 suggests that the price action is gearing up for a downside reversal. A significant technical correction is already well overdue regardless. We're jumping into a new short position, targeting the next important key-level support at 8.23

Polkadot (DOT) Price Prediction: $10 to $52 – Key Targets AheadPolkadot (DOT) is currently trading at $10, with bullish momentum aiming for key targets: $22, $32, and a final target of $52. Enter when weekly candle closes above $13.6 in weekly. Analyze the market trends and strategic levels driving DOT’s potential surge. Is this the next big breakout?

Polkadot (DOT) Price Prediction: $10 to $52 – Key Targets AheadPolkadot (DOT) is currently trading at $10, Enter above $13.6 in weekly chart with bullish momentum aiming for key targets: $22, $33, and a final target of $52. Analyze the market trends and strategic levels driving DOT’s potential surge. Is this the next big breakout?

$DOT Will it continue the uptrend?Volumes seem promising for CRYPTOCAP:DOT to continue it's uptrend. Price action yet to support the idea. Another 15-20% rally could be seen very soon

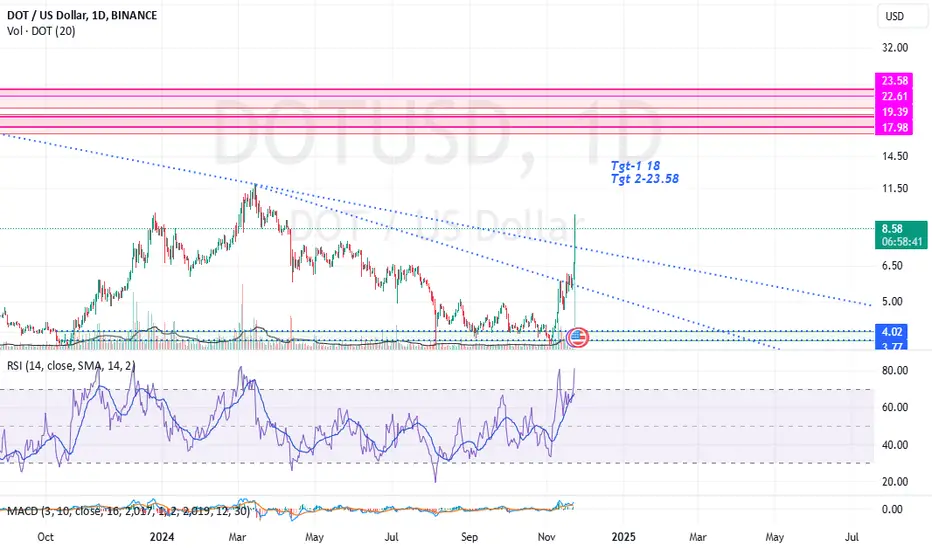
POLKADOT with an increase possibility of (+120%)Polkadot is shifting in the monthly timeframe to bullish, is getting supported by the value area high from may22 to now and above the anchored vwap from jan22 highs, if price stays above $9 till the end of this week will be good for that happen. Is showing great momentum to continue reaching higher prices. The target is situated between monthly/weekly level with fibonacci levels from dec21 highs, big resistance zone and point of control from last bull run.
TARGET: $18,70 to $23,20 up to (+120%)

Potential HVF on DOTCons, low slung. Biased to down side, if we were in a moderate market.
Pros, we are not in a moderate market. We're in an alt season. Other low slung hvfs have performed to upside repeatedly.
Other pro is W bottom on higher time frame gives bullish target that is much higher than hvf target.
Ambiguity, is that the hvf could break and perform but still sell off and not trigger the W bottom movement. It may come up to several weeks later.

POLKADOT - Buy Idea (Short-term)The breakout above the key-level resistance at 8.54 is evident. Further move upwards is highly likely at this point. The defined range the Dot is trading in lately suggests that the next key-level is at 9.1480. Firing off a new Buy trade.


Polkadot / U.S. Dollar | Chart & Forecast SummaryKey Indicators On Trade Set Up In General
1. Push Set Up
2. Range Set up
3. Break & Retest Set Up
Notes On Session
# Polkadot / U.S. Dollar
- Triple Formation | Neckline At 5.0960
- Wedge Structure | Bearish Trend | Bias On Hold
- Invalid Target At 2.5600
- Retracement | 50% | Awaiting Target At 11.8350
Active Sessions On Relevant Range & Elemented Probabilities;
London(Upwards) - NYC(Downwards)
Conclusion | Trade Plan Execution & Risk Management On Demand;
Overall Consensus | Buy

POLKADOT (DOTUSD): Great Buying Opportunity
I see a nice bullish signal on DOT after a retest of a recently broken
key daily horizontal resistance.
The price formed a tiny ascending triangle pattern on that
and violated its neckline.
I expect a growth at least to 9.19.
❤️Please, support my work with like, thank you!❤️

DOTUSD (1W) - buy the dip Hi traders,
Here it is my idea for a long position on DOTUSD (1 week time frame).
the price hit a local high in March 2024 and hit another high in November 2024, after that the price bounce back and is currently experiencing the pullback. The idea is to enter in the buy area, which is determined by a previous resistance zone that can be a support for a bounce up now. The best would be if the price will hit the SMA in the buy area and use it as a support too. The buy area is between 7.585 and 6.625.
We will put our first take profit at the level of the last high and the second take profit at 16.900 where there was a support in February 2022.
good luck

Triple Top - Ready to popLooking on the left 2 day chart, you can see this is the main support/resistance level from prior run ups. Ideally we get a breakout through this resistance and a retest of this level, confirming support, and buying pressure above.
This will send it over 7 easily, and to stay conservative, my first target is 7.5. Beyond that will be runners and dip buying.
Looking for Bitcoin to consolidate after its recent ATH break through 94k today. Consolidation will allow money to flow around through alts. With this one being so tight, we only need a little bit of that volume to breakout.

Polkadot working on an invh&s and a double bottomThis inverse head and shoulders pattern almost got nullified when price starting heading back towards the head but since price never went below the head it’s surprisingly still in play. It also got low enough to the head to create a double bottom pattern n the process. The double botto pattern has an even higher neckline than the inverse head and shoulders and thus a higher breakout target. *not financial advice*