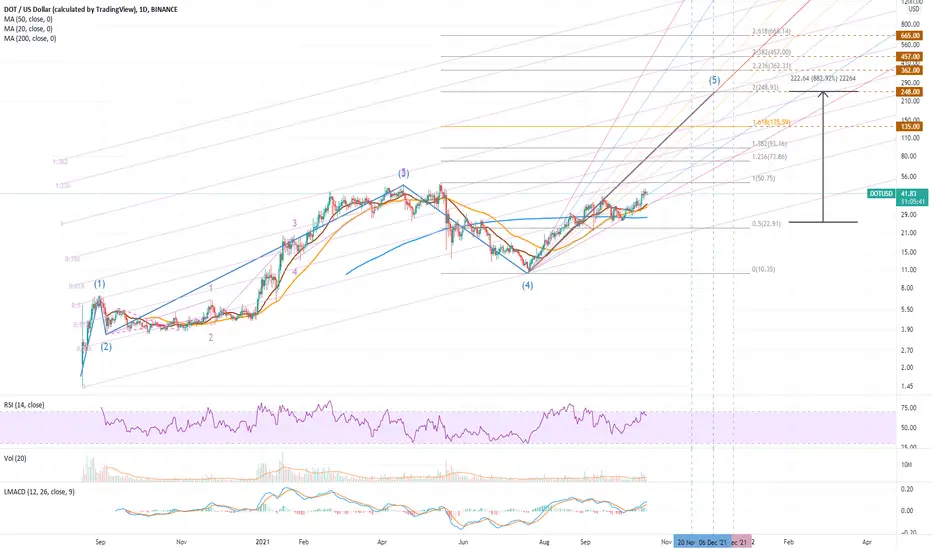
Polkadot (DOT) - Structure and TargetsA study in DOT, identifying a Fibonacci Channel containing the price action, a Pitch Fan providing lines of support and resistance, and an Elliot Wave apparently working its way towards a wave 5 climax.
What are your target levels for DOT and when will they hit?
DOTUSD.P trade ideas
Polkadot (DOT) - October 17Hello?
Welcome, traders.
By "following", you can always get new information quickly.
Please also click "Like".
Have a nice day.
-------------------------------------
(DOTUSD 1W Chart) - Mid-Long-Term Perspective
Above the 10.16 point: expect the uptrend to continue
16.15-20.27 or more: Expected to create a new wave.
(1D chart)
A volume profile section is formed over the section 10.16-23.03.
Accordingly, if the price is maintained above this range, it is expected to create a new wave.
Also, if the price is maintained above the support and resistance zone formed over the 29.85-38.69 zone, the uptrend is expected to accelerate and record a new high.
If it falls from the 29.85 point, a short-term Stop Loss is required.
------------------------------------------
We recommend that you trade with your average unit price.
This is because, if the price is below your average unit price, whether it is in an uptrend or in a downtrend, there is a high possibility that you will not be able to get a big profit due to the psychological burden.
The center of all trading starts with the average unit price at which you start trading.
If you ignore this, you may be trading in the wrong direction.
Therefore, it is important to find a way to lower the average unit price and adjust the proportion of the investment, ultimately allowing the funds corresponding to the profits to regenerate themselves.
------------------------------------------------------------ -----------------------------------------------------
** All indicators are lagging indicators.
Therefore, it is important to be aware that the indicator moves accordingly as price and volume move.
However, for the sake of convenience, we are talking in reverse for the interpretation of the indicator.
** The MRHAB-O and MRHAB-B indicators used in the chart are indicators of our channel that have not been released yet.
(Since it is not publicly available, you can use this chart without any restrictions by sharing this chart and copying and pasting the indicators.)
** The wRSI_SR indicator is an indicator created by adding settings and options to the existing Stochastic RSI indicator.
Therefore, the interpretation is the same as the traditional Stochastic RSI indicator. (K, D line -> R, S line)
** The OBV indicator was re-created by applying a formula to the DepthHouse Trading indicator, an indicator disclosed by oh92. (Thanks for this.)
** Support or resistance is based on the closing price of the 1D chart.
** All descriptions are for reference only and do not guarantee a profit or loss in investment.
(Short-term Stop Loss can be said to be a point where profit and loss can be preserved or additional entry can be made through split trading. It is a short-term investment perspective.)

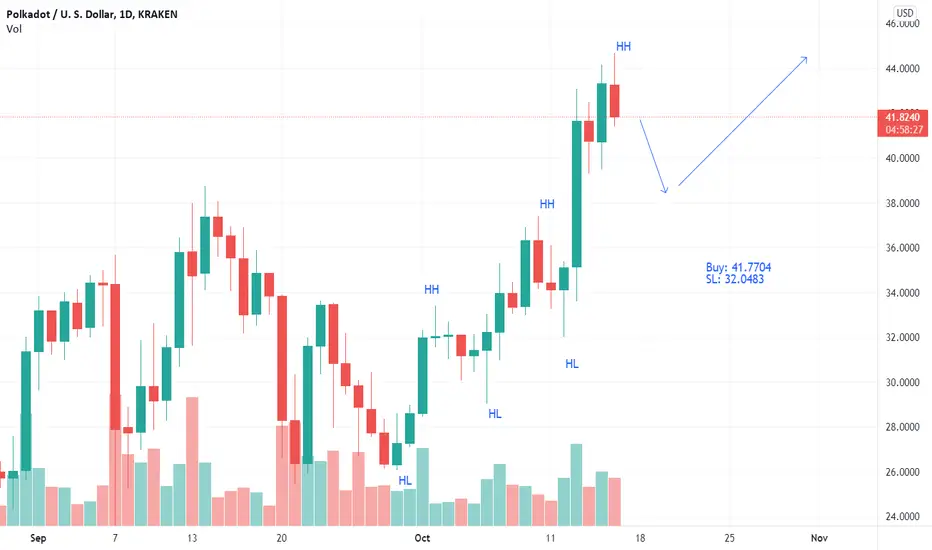
Polkadot/Usd, 1D, 16 OctOn 1D timeframe, this Polkadot/Usd is expected to go above as it has been continuously making new highs since 29th September and also not breaking the previous lows.
DOT buying pressure increasesbuying pressure from the accumulation distribution line solidifies the price action. expecting a pump.
ema 9 first bounce off ema 26 a bit weak. many times these bounces have 2 waves.

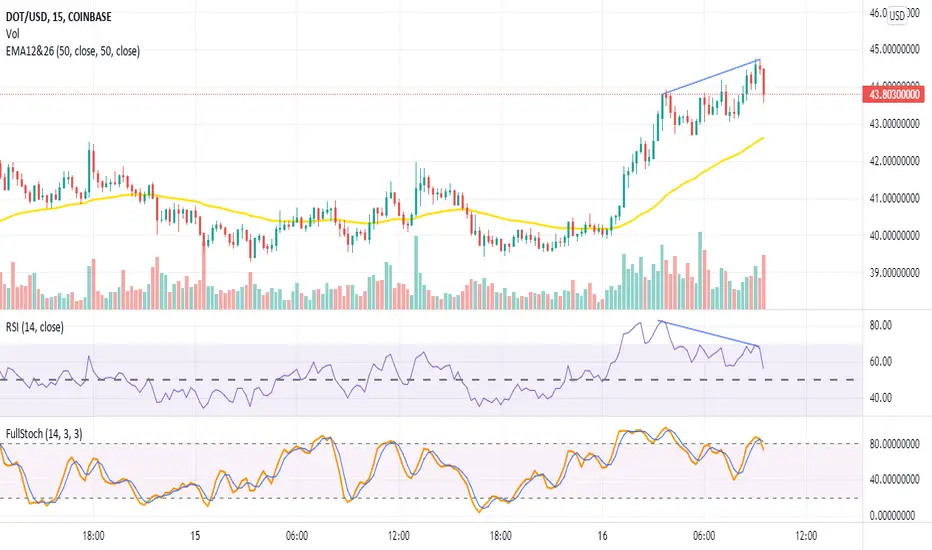
DOT pullback, going back to 39 zone?Rally not convincing as per RSI and Stochastic crossing over. Needed some pullback before it continues to go up.
What's your take guys? 39 or 50 ?

DOT Bullish potentialDOT broke the 38.5$ / 40$ resistance with volume, MACD Wk and MACD Daily are looking good.
Anything between current price and 38.50$ should be seen as buying opportunity to target 50$ region.
On the other hand, if we break back down the EMA4 and the zone we could see a retracement down to 32$.
My Bias would be to go long on this coin as long as 38.5$ is not broken in daily.

Bearish Cypher on PolkadotI suspect this will reverse in a similar way to algo my short zone is in between the .786 and .886


Polkadot DOTUSD Elliott waves projectionAnalysis based on Elliott waves projection
Black lines are for exiting your positions gradually

DOT Just want to share my TA with the community and get feedback if possible, what do you guys think about this potential inverted head and shoulders on DOT? KRAKEN:DOTUSD

Chapter 1 of the DOT Story - Polkadot Parachains Polkadot is just really getting started. Today the parachains were announced and the PA reacted instantly.
A famous saying goes "show me the charts, I'll tell you the news".
Well right at the end of a near perfect cup n' handle, parachains were announced. Coincidence? Fibonacci? Random word to sound smart yet mystic-like?
Whether you buy in now or the retest around $37-$40, this is your choice. But 5-10 years down the line when 1 DOT token will be valued over $10,000, you are not going to care whether you bought the retest or not.
$10,000 how? Simple. Polkadot is a layer 0 solution. It is naturally going to solve every other blockchain's problems of scalability vs speed vs decentralisation with its parachains. Don't be surprised if we see a Solana or an Ethereum bidding for a parachain someday to fix their own issues that won't be solved by their (dare I say) centralised base layers.
If there is 1 token that will not only overtake ETH, but overtake BTC, I have my money on DOT. Assuming of course nothing drastic happens to their code.
Why?
DOT's utility is made to drive the price up. When the community are leasing DOT tokens for up to 2 years at a time - multiply that by 100 (for the number of parachains) and then add the fact there will be a large chunk put into staking for governance and, furthermore, DOT's that will be in corporations and countries' balance sheets/crypto reserves, what's left is a very little supply of DOTs left circulating for us.
Let history remember this.

DOTUSD - Polkadot's road to recovery point 50Interval: 4hrs
Description: Polkadot shows substantial recovery toward the resistance line of $42. And after that bulls should easily can get to recovery point 50.

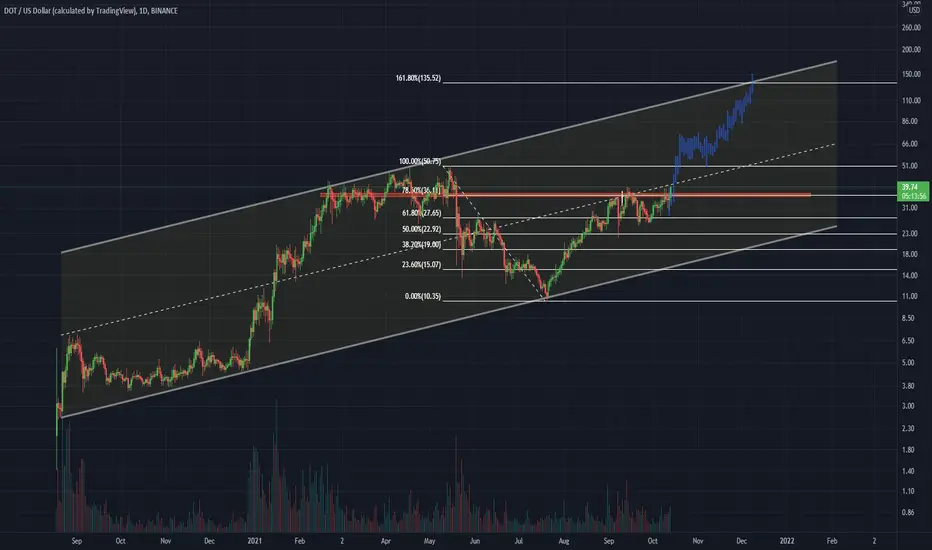
DOT/USD Parallel channelCan DOT get up to the top of the channel again and finish there around the 1.618 ?
Happy trading!
DOT $150 Summer 2022DOT is going to have an amazing Q4 and into 2022
Currently in Wave 3, so far it satisfies an impulse Neo wave, extremely bullish in the near term
SHORT TERM
$50
$75 EOY
LONG TERM
$100
$150 Q2 2022

Polkadot daily chartToday I took a look at the Polkadot chart. And as usual I first looked at daily chart. And what I found? There is a huge resistance at approximately 38-39$. So far, DOT has had a lot of trouble breaking through that resistance. However, when will DOT successfully breake this resistance, I expect explosive growth. Especially in anticipation of the upcoming parachain auctions. I expect at least 100$ DOT.

NEoWave Analysis of polkadot Chart within Daily time frameNEoWave Analysis of Gold Chart within Daily time frame

looooooooooong polkadot prediction, just for funlol i will check in few years, i just imagined a similar path as eth


DOTUSD PRICE PREDICTIONI don't know it will happen or not just playing with charts for fun. Please don't use it as your investment advice.
Not consider any blackswan event:
By the end of January/early Feb 2022: $132
By April retrace: $50
By June/July: $242-$370

Polkadot Holding ResistanceDot so far hold is building up for an explosion!
We are holding our Horizontal & Trend Line Support.
Hoping to see a nice bounce that sets us up for
making Higher Highs and Lower Lows!

1 year PitchFan on DOT Simple PitchFan on DOT
PitchFan/Fork is created by selecting 3 pivot points.
enjoy!
