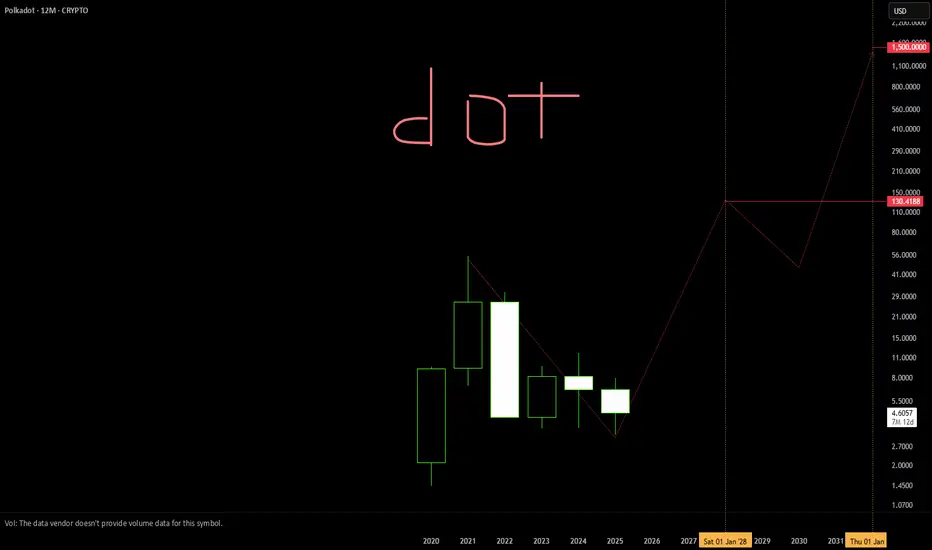
dot: $4.59 | My Precious it's the thing that links the thing that runs the thing of everything
this could be the one to rule em all
strategy: own it as overnight success may happen come 2027-2028
tactic: get volume when it dumps or reset
DOTUSD trade ideas
An example of smart money conceptPrice has to tap into the origin of the BOS in order to enter a position.

DOTUSD📊 30m Analysis – DOTUSD
Strategy: 🐊 Alligator Strategy
Trend: 📈 Strong Uptrend
📝 Trade Plan
🎯 Entry Point (EP): 4.603
🛡️ Stop Loss (SL): 4.530
💰 Take Profit 1 (TP1): 4.680
💰 Take Profit 1 (TP1):4.75
Risk Reward 1:1 TP1
Risk Reward 1:2 TP2

Dot have potential to catch move like EthereumBullish trend making HH may go down for HL
Rsi divergence
Reversal pattern falling wedge
Manage your risk before entering position in real account.

DOTUSD – 1D Bullish Setup in Play | Swing Target $11DOTUSD – 1D Bullish Setup in Play | Swing Target $11 💥📈
What’s up crypto traders 👋
DOT (Polkadot) is starting to turn heads on the daily chart with a bullish structure that looks ready for a bigger move. The market's been in accumulation mode, but the signs are pointing toward an upcoming breakout — let’s break it down.
🧠 Bullish Structure Forming
After a long consolidation, DOTUSD is showing higher lows, and the recent price action is pushing against resistance with increasing momentum. This kind of behavior is typical before a major breakout.
Momentum indicators (RSI, MACD) are showing strength. Volume is starting to pick up, and price is holding above key EMAs. That’s exactly the kind of quiet buildup that often precedes explosive moves in altcoins.
🎯 Targeting $11 – Swing Setup
The medium-term structure suggests that DOT has room to run — $11 is the clean target, lining up with previous supply and structural resistance.
📍 Entry: From current price levels (already positioned)
❌ Stop Loss: $3 — wide, but protects against shakeouts and gives the trade space
✅ Target: $11 — aligns with swing structure and market memory zones
That’s a strong R:R profile if this plays out — worth the patience if you’re playing the daily chart.
⚠️ Risk Consideration
This is a high-timeframe swing, not a scalp.
Requires patience and clear conviction — no chasing.
SL is deep, so position sizing is key. Risk what fits your plan, not what looks good on paper.
📌 DOT Looks Ready to Move – Are You Positioned?
Are you in on DOT or still waiting for confirmation? Let me know your view — bullish continuation or another trap?
#DOTUSD #Polkadot #CryptoTrading #Altcoins #SwingTrade #BullishSetup #1DChart #PriceAction #SmartMoney #CryptoAnalysis

$DOT is showing bullish momentum. What do you think?DOT is looking good and printing reversal patterns. Need other technical reasons to buy Polkadot? check this out:
* Enhanced Interoperability via XCM
* Scalability through Parachains
* Shared Security Model
* Advanced Governance System (OpenGov)
* Parachain Auctions and Ecosystem Growth
BINANCE:DOTUSDT

Polkadot: The Blockchain That Outclasses Ethereum 2.0In the ever-evolving blockchain world, Ethereum famously pioneered decentralized applications and smart contracts. However, as Ethereum 2.0 attempts to fix its inherent scalability and energy challenges, it still falls short of delivering true interoperability and ease of use. This is where Polkadot comes in—a platform designed from the ground up to fulfill the promise of a genuinely decentralized, scalable, and interconnected blockchain ecosystem.
Ethereum 2.0’s Unmet Promises
Ethereum 2.0 represents a significant upgrade, transitioning from a proof-of-work system to proof-of-stake in hopes of better scalability and energy efficiency. Yet, its approach—relying on sharding and rollups—has introduced complexity rather than simplicity. Despite tremendous hype, Ethereum 2.0’s incremental changes have made it challenging for the network to achieve a seamless, interoperable ecosystem. The result is a network still burdened by congestion and high fees, unable to fully liberate the potential of decentralized finance and applications .
How Polkadot Revolutionizes the Scene
Polkadot’s architecture is the antithesis of Ethereum 2.0’s convoluted upgrades. Rather than retrofit scalability into an established network, Polkadot was built from scratch with interoperability at its core. Its unique design centers on a relay chain, a central hub through which secure, scalable, and parallel blockchains—known as parachains—interact. Each parachain can be optimized for different use cases, yet they all benefit from the robust, shared security of the relay chain. This elegant solution empowers Polkadot to process transactions concurrently, drastically reducing congestion and fees while ensuring a truly decentralized environment .
A Clear, Undoubtful Advantage
There’s a disruptive clarity in Polkadot’s design that sets it apart:
- True Scalability: While Ethereum 2.0 employs sharding to process multiple blocks, Polkadot’s multiple parachains operate in parallel. This provides a more natural, scalable method for handling high volumes of transactions without compromising security.
- Seamless Interoperability: Polkadot’s architecture was envisioned to connect disparate blockchains. Cross-chain communication is built into its very DNA, something Ethereum 2.0 still struggles with.
- Robust Security Without Centralization: With the relay chain securing all parachains, Polkadot avoids the pitfalls of isolated blockchains vulnerable to attacks or whale-driven volatility—a persistent issue with Ethereum’s evolving network.
- Community-Driven Innovation: Unlike Ethereum 2.0’s upgrade path that remains mired in complexity and centralization, Polkadot’s modular platform invites developers to build specialized blockchains that work harmoniously together, fostering an enriched ecosystem from day one.
The Road Ahead
In essence, Ethereum 2.0 promised to solve the issues of its predecessor yet found itself entangled in complexity and compromise. Polkadot, in contrast, delivers a clear vision from inception—a blockchain ecosystem that isn’t just a platform for speculation but a foundation for true decentralized interoperability. It’s not about making quick millionaires; it’s about building a sustainable, transformative infrastructure that can underpin the future of digital finance and beyond.
With its innovative design and community-first approach, Polkadot is poised to become the decentralized network of choice—one that will eventually outpace Ethereum and redefine what a blockchain ecosystem can be.
The future isn’t about patching up old systems; it’s about building something entirely new. And in this race, Polkadot is not only winning—it’s setting the pace.
CRYPTO:DOTUSD NASDAQ:COIN

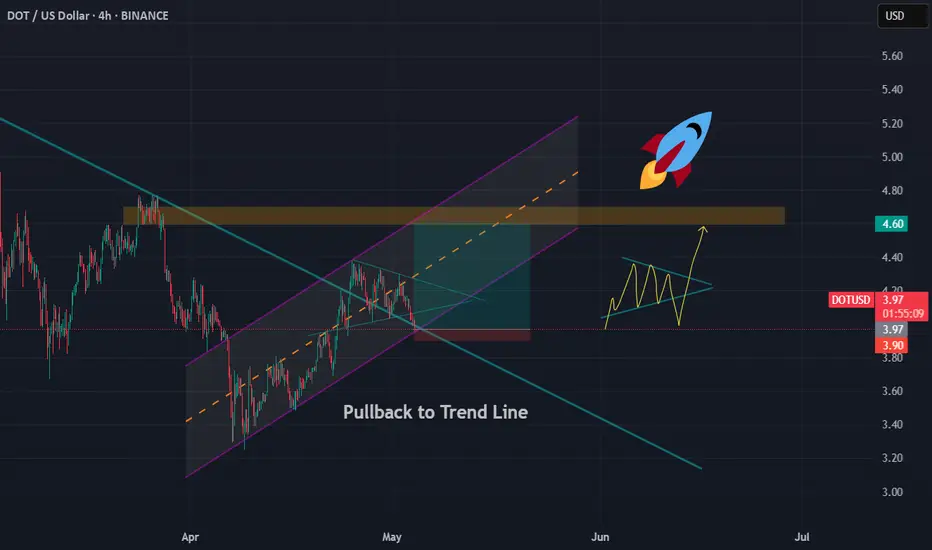
DOT : Long PositionEverything is clear..
We can get a long position because price break the trend line and is up of It.
DOT: The Bullish Reversal#DOT has been presenting a corrective structure since Oct 2023, likely forming a major corrective bullish wave within a broader bearish trend.
The count below suggests a potential bullish reversal soon within that larger structure.
#Polkadot

DOT/USD "Polkadot vs U.S Dollar" Crypto Heist (Scalping / Day)🌟Hi! Hola! Ola! Bonjour! Hallo! Marhaba!🌟
Dear Money Makers & Robbers, 🤑 💰💸✈️
Based on 🔥Thief Trading style technical and fundamental analysis🔥, here is our master plan to heist the DOT/USD "Polkadot vs U.S Dollar" Crypto Market. Please adhere to the strategy I've outlined in the chart, which emphasizes long entry. Our aim is to escape near the high-risk MA Zone. Risky level, overbought market, consolidation, trend reversal, trap at the level where traders and bearish robbers are stronger. 🏆💸"Take profit and treat yourself, traders. You deserve it!💪🏆🎉
Entry 📈 : "The vault is wide open! Swipe the Bullish loot at any price - the heist is on!
however I advise to Place buy limit orders within a 15 or 30 minute timeframe nearest or swing low or high level for pullback entries.
Stop Loss 🛑:
📍 Thief SL placed at the recent/swing low level Using the 4H timeframe (3.450) Scalping/Day trade basis.
📍 SL is based on your risk of the trade, lot size and how many multiple orders you have to take.
🏴☠️Target 🎯: 4.000
💰💵💸DOT/USD "Polkadot vs U.S Dollar" Crypto Market Heist Plan (Day / Scalping Trade) is currently experiencing a bullishness,., driven by several key factors.☝☝☝
📰🗞️Get & Read the Fundamental, Macro, COT Report, On Chain Analysis, Sentimental Outlook, Intermarket Analysis, Future trend targets.. go ahead to check 👉👉👉🔗
⚠️Trading Alert : News Releases and Position Management 📰 🗞️ 🚫🚏
As a reminder, news releases can have a significant impact on market prices and volatility. To minimize potential losses and protect your running positions,
we recommend the following:
Avoid taking new trades during news releases
Use trailing stop-loss orders to protect your running positions and lock in profits
💖Supporting our robbery plan 💥Hit the Boost Button💥 will enable us to effortlessly make and steal money 💰💵. Boost the strength of our robbery team. Every day in this market make money with ease by using the Thief Trading Style.🏆💪🤝❤️🎉🚀
I'll see you soon with another heist plan, so stay tuned 🤑🐱👤🤗🤩

Polkadot (DOT) Analysis: Bullish Breakout on the Horizon?
📊 Technical Analysis (1H Chart):
The 1-hour chart of DOT/USD on Kraken shows a promising setup. After a prolonged downtrend within a descending channel, DOT has broken above the upper resistance trendline, signaling a potential trend reversal. The price is currently testing the $3.6946 level, with a key support zone around $3.6716 (recent low). If this support holds, we could see a push toward the next resistance at $5.252 (previous high), as indicated by the green target zone. However, a failure to hold $3.6716 might lead to a retest of the $3.500 support (red zone). Volume is increasing, supporting the breakout momentum.
🌐 Fundamental Update:
Polkadot’s network has been making strides with recent upgrades, including the rollout of Asynchronous Backing, which significantly boosts transaction throughput and scalability. This update strengthens Polkadot’s position as a leading layer-0 protocol for cross-chain interoperability. Additionally, rumors of a potential Polkadot ETF application have been circulating, following the success of Bitcoin and Ethereum ETFs. If approved, this could bring substantial institutional interest and capital inflow to DOT, further driving its price.
📈 Conclusion:
With a technical breakout in play and strong fundamentals from network upgrades and ETF speculation, DOT looks poised for a bullish move. Keep an eye on the $3.6716 support for confirmation of the uptrend. What are your thoughts on DOT’s next move? Let’s discuss! 👇
#Polkadot #DOT #CryptoAnalysis #Trading #ETF

Weekly chart shows potential base forming for DOTOn the BINANCE:DOTUSDT 1W chart, price has recently tested a long term support zone near 3.54. This area has previously acted as a strong demand zone, and the reaction from it could suggest that buyers are stepping in once again. The Ichimoku cloud (10, 20, 40, 10) shows ongoing bearish pressure, but the current structure may be forming a double bottom or accumulation pattern. A break above the mid range and a retest of the 5.50 area could serve as confirmation that the trend is shifting. If this scenario plays out, price may aim for the next resistance zone around 10.20. Until then, this setup remains in development and lower timeframes will be key to confirm early signs of strength.
Disclaimer: This content is for educational and informational purposes only. It does not represent financial advice or a recommendation to buy or sell any financial instrument. Trading involves risk, and you should only trade with money you can afford to lose.

DOT Downside PendingMarkets sentiment is massively risk off at the moment, and shorting cryptocurrencies (other than btc) seem like a good choice.
Dot has broker the rising trendline and looking to sell into range support.

DOT - Strong bounce from the ultimate low ?Bounced each time for consequent gains around 3.75, so I expect the same now
placed a SL a bit wide, a good fuel could be the 2.0 update of Polkadot but didn hear any news about it to be honest
In the other hand, lower would means I'll quit this asset for a mid/long term hehe,
Cheers

DOT/USD "Polkadot vs U.S Dollar" Crypto Market Heist Plan🌟Hi! Hola! Ola! Bonjour! Hallo! Marhaba!🌟
⚔Dear Money Makers & Thieves, 🤑 💰✈️
Based on 🔥Thief Trading style technical and fundamental analysis🔥, here is our master plan to heist the DOT/USD "Polkadot vs U.S Dollar" Crypto market. Please adhere to the strategy I've outlined in the chart, which emphasizes long entry. Our aim is the high-risk Red Zone. Risky level, overbought market, consolidation, trend reversal, trap at the level where traders and bearish robbers are stronger. 🏆💸Book Profits wealthy and safe trade.💪🏆🎉
Entry 📈 : "The vault is wide open! Swipe the Bullish loot at any price - the heist is on!
however I advise to Place buy limit orders within a 15 or 30 minute timeframe most recent or swing, low or high level. I Highly recommended you to put alert in your chart.
Stop Loss 🛑:
Thief SL placed at the recent/swing low or high level Using the 4H timeframe (3.800) swing trade basis.
SL is based on your risk of the trade, lot size and how many multiple orders you have to take.
Target 🎯:
🏴☠️Target 1 - 4.700 (or) Escape Before the Target
🏴☠️Target 2 - 5.600 (or) Escape Before the Target
🏴☠️Target 3 - 6.600 (or) Escape Before the Target
🧲Scalpers, take note 👀 : only scalp on the Long side. If you have a lot of money, you can go straight away; if not, you can join swing traders and carry out the robbery plan. Use trailing SL to safeguard your money 💰.
DOT/USD "Polkadot vs U.S Dollar" Crypto Market is currently experiencing a bullish trend,., driven by several key factors.
📰🗞️Get & Read the Fundamental, Macro Economics, COT Report, On-Chain Analysis, Sentimental Outlook, Future Trend Move:
Before start the heist plan read it.👉👉👉
📌Keep in mind that these factors can change rapidly, and it's essential to stay up-to-date with market developments and adjust your analysis accordingly.
⚠️Trading Alert : News Releases and Position Management 📰 🗞️ 🚫🚏
As a reminder, news releases can have a significant impact on market prices and volatility. To minimize potential losses and protect your running positions,
we recommend the following:
Avoid taking new trades during news releases
Use trailing stop-loss orders to protect your running positions and lock in profits
💖Supporting our robbery plan 💥Hit the Boost Button💥 will enable us to effortlessly make and steal money 💰💵. Boost the strength of our robbery team. Every day in this market make money with ease by using the Thief Trading Style.🏆💪🤝❤️🎉🚀
I'll see you soon with another heist plan, so stay tuned 🤑🐱👤🤗🤩

Polkadot: Shaky SupportPolkadot remains weak, barely holding onto the round $4 mark on Friday. Primarily, we soon expect another sell-off below the support at $3.67 and into the orange Target Zone between $2.40 and $1.07. Once the low of the magenta wave is reached down there, the next major impulsive movement can start and carry the price back above the resistance at $5.38. If Polkadot turns sustainably upward now and directly breaks through the $5.38 mark, the next magenta impulse wave alt. will begin prematurely. In this 20% likely alternative scenario, the corrective structure (still ongoing according to the primary scenario) would have already been completed with the low of March 11.

DOTUSD: There is no better buy entry than this.Polkadot has been inside a huge Rectangle pattern since the October 19th 2023 Low that created the S1 Zone, a wide consolidation pattern whose top is the R1 Zone. The 1D RSI is already on a HL bullish divergence, identical to both prior bottom formations on the S1 Zone. Since the 1D MA50 has already been breached, we estimate that the price will start the new bullish wave soon. There is no better buy entry than the current level. Aim for the bottom of the R1 Zone (TP = 11.500).
## If you like our free content follow our profile to get more daily ideas. ##
## Comments and likes are greatly appreciated. ##

DOTUSD dailyThe price action suggests that a corrective wave might have completed its lower leg, and we could be entering the impulsive wave phase of a bullish cycle. Look for the formation of a five-wave structure typical of Elliott Wave theory, where the upward waves push through resistance levels and the corrective waves provide buying opportunities.
Given the breakout above the descending trendline and the potential for a bullish wave structure, the current setup appears favorable for a buy, provided that support at $6 holds and volume confirms the upward move. However, maintain caution with appropriate risk management measures in place.

Buying zone4$ is strong support and Polkadot's buying zone, from there I expect price to rise to 10-12$ which in two occasions acted as resistance.

DOT/USD LONG SET UPTime Frame: 1D
Entry Price 1: $4.40
Entry Price 2: $3.40
Stop Loss: $2.40
Take Profit 1: $5.40
Take Profit 2: $7.50
Take Profit 3: $9.50
Take Profit 4: $11.50
Status: ACTIVE

Polkadot $DOT 2025Currently forecasting Polkadot to bounce off of the major support zone where the current market price is at $4-5. Expecting 3 different targets to remain until the end of the bull run cycle, with targets ranging from 300% to 1000%.

DOTUSD attractive Set-up 12hrTargetting 7-dollar region following a back test of falling wedge breakout area. Stops set at 4.5 feels god R:R on this set-up.
Some strong volume required to allow for a sustained push
