DOT / USD, Double Bottom Chart Pattern AnalysisAccount Size: 9670
Risk: 1%
Buy Stop: 6.4
Stop Loss: 5.95
No. of Coins: 215
TP-1: 6.9
TP-2: 7.4
DOTUSD trade ideas

DOTUSD 1H - Bear TrendAnalysis:
DOTUSD is currently in a bearish trend. If the price breaks below 5.92 which is previous lower low level, it will be a sign of bear trend continuation. In this case we can enter in a short trade. For this trade the stop loss will be at 6.48 which is the previous lower high level.
------ Trade ------
Type: Short
Entry: 5.92
Stop Loss: 6.48
TP1: 5.36
TP2: 4.80

DOTUSD-Bearish Divergence-Falling WedgeDOTUSD has shown a bearish divergence by using RSI indicator. Now it is forming falling wedge. We predict that it's price will have a breakdown towards downside and we will place a Sell Stop order.

Possible 3 of a 3 of a 3Cute little nest in progress (1-2 1-2). That's how the price reacting to the bankrun?

Polkadot's Bear RunThis one isn't as clear either and looks like it wants to reverse.
It looks like it wants to go up.
The bearish cross can lead to just that, a short-term reversal but it signals a mid/long-term drop.
Look at the volume, it has been decreasing.
The Altcoins move together.
What one does the rest follows...
Polkadot (DOTUSD) is also likely to go down before the next bullish run.
Namaste.

DOT PERSONAL ANALYSIS IN THE NEXT 1-3 DAYS The total evaluation for the Polkadot asset is bearish in both long-term and short term time frames. The weekly chart has an obvious arch to the downside but in the hourly chart, you can see a more detailed scenario of where and when you can put a proper short position with confirmation of resistance. The projection can easily go to the downside up to 5.15$ with a MAX weekly downside up to 4.8-5$ -- After that, DOT is a barren wasteland to trade so its better to trade other assets for a better idea on direction and position.
Please take in consideration as well the upcoming CPI inflation data report and make sure to take profits appropriately.
DO NOT BE GREEDY.
-----
If you like the content, please feel free to comment, boost, react, or share. I would appreciate it. Thanks!
-Wamses

Polkadot Bullish Divergencespotted some bullish divergence on polkadot which looks promising as one of the market leaders, and one of the strongest parachain tokens. would be neat to see it turn around and help the market as a whole

Weekend update - Polkadot and our alt.(ii)Quite a few traders reached out to me in the last days since I posted our first updates on Polkadot and Vechain. Both coins could gain further momentum in the last days and slightly overshot our wave (i) top estimation.
Today we start with Polkadot, and before we dive into the count, I would like to highlight that everybody should carefully read our assumptions about a possible alt.(ii) which can be seen on the chart.
We assume that Polkadot established its original wave (i) high back on the 23rd of January at 6.813$. Since then the coin moved in multiple a-b-c waves which as of now point towards an expanded flat correction in which the upcoming wave (c) should deal the most damage. So we expect a very similar movement in most altcoins in the next days, the movements in polkadot and solana resemble an expanded flat. The rules are the same as described in our last article, the price should enter the blue retracement box and from there on should gain bullish momentum again.
We provided a more detailed count below, featuring the important alt.(ii). As of now it’s difficult to estimate how long this wave (ii) correction will last and the important question is now – will Polkadot already bottom after the upcoming yellow wave (c)?
This scenario would mean that Polkadot will decline in a 5 wave impulse in the next days and therefore would finish the whole wave (ii) correction already. Because of this, we will start to accumulate in this next wave already and won't speculate on a lower wave (c) marked in red.
Investors who aren’t familiar with the Elliot wave theory might be overwhelmed with this count, feel free to ask questions below in the comment section or just message us directly – we are happy to help!
Please note that we are already invested Polkadot since the 29th of July, back then we announced our first positions here on tradingview.
Long Polkadot (DOTUSD)
AVERAGE EXECUTION PRICE: 7.33
STOP-LOSS: NONE
LONG TERM TARGET: 55$ and more

DOTUSD (4H) - Bearish breakoutHi Traders
DOTUSD (4H Timeframe)
The market is in a downtrend and we are waiting for an entry signal to go SHORT below the 5.73 support level. Only the upward break of 6.06 would cancel the bearish scenario.
Trade details
Entry: 5.73
Stop loss: 6.06
Take profit 1: 5.54
Take profit 2: 5.21
Score: 9
Strategy: Bearish breakout

POLKADOT - BOTTOM IS IN!From looking at POLKADOT on a high timeframe, we can see that Polkadot has completed wave 2 PERFECTLY and the bottom is in.
We are now looking to ride wave 3, we made one impulse to the upside and now we are correcting that move.
See lower timeframe analysis for the breakdown.
Trade idea:
- Watch for the completion of the current correction
- Enter at the break of wave 2, stops must be below the bottom
- Targets: 14, 24, 54, HODL the rest
Goodluck and as always, trade safe.

Polkadot: On the Dot ⌚️Polkadot has already made further progress in our primary scenario and should continue the downwards movement. We expect our crypto-friend to arrive in the magenta-colored zone between $6.49 and $6.06 on the dot to finish wave a in green. Then, the altcoin should apply itself to the countermovement of wave b in green, which should lead out of the magenta-colored zone but stop before the resistance at $7.89. Afterwards, Polkadot should take another southwards step by completing wave c in green as well as wave ii in orange. Alternatively, there is a 40% chance that Polkadot could climb above the resistance at $7.89, thus shifting the recent high upwards by developing wave alt.i in orange.

My PolkaDot Buy ZoneOne of these days Dot is going make me some money, not today, but one of these days, maybe..
DOTUSD - Crypto | Bullish TrendDOTUSD is a Crypto coin and it is showing a Bullish Trend with HHs and HLs . It is expected that this trend will continue further.

Reinvesting DOT profits JUST CRUSHED a prior trade. TAGGED below! :-)
I'm taking those profits and taking this trade! =-)


DOTUSD Roadmap to $19.50 - 24.00DOTUSD/ Polkadot hit the 7.40 Resistance A, filling the gap of November 7th. We are about to form a 1day Golden Cross and the next MA Resistance is the 1W MA50 but the gap to fill is on Resistance B at 9.70. We can see a strong bullish wave in the next two months with the 1day MA50 supporting. If Resistance C breaks, a huge bullish leg is expected within 19.50 and 24.00.
Follow us, like the idea and leave a comment below!!

dot dumpdot is forming a head and shoulders on the daily, as the alt cap begins to look week and btc to be rejected at 25k. i expect dot to go under $6. but also look for support around the $6 area. rsi continues to weaken which is another sign

DOTUSD - A Quick 10% Gain After Breaking Trend LinePolkadot seems to have just broken through that long descending trend line after testing this line a few times historically. There's a good area for the price to head to of recent consolidation so we'll be aiming for around 10% gains to reach the bottom edge of this area after a Buy signal from Crypto Tipster v2.
If you enjoyed or agree with this idea - drop us a comment, like & follow! :)
***

DOTUSD Potential for Bullish Continuation| 26th January 2023Looking at the H4 chart, my overall bias for DOTUSD is bullish due to the current price being above the Ichimoku cloud , indicating a bullish market. With price tapping into my buy entry at 6.124, where the overlap support and 23.6% Fibonacci line is, we are looking to take profit at 7.415, where the previous swing high is. Stop loss will be placed at 5.704, where the previous overlap support is.
Any opinions, news, research, analyses, prices, other information, or links to third-party sites contained on this website are provided on an "as-is" basis, as general market commentary, and do not constitute investment advice. The market commentary has not been prepared in accordance with legal requirements designed to promote the independence of investment research, and it is therefore not subject to any prohibition on dealing ahead of dissemination. Although this commentary is not produced by an independent source, FXCM takes all sufficient steps to eliminate or prevent any conflicts of interest arising out of the production and dissemination of this communication. The employees of FXCM commit to acting in the clients' best interests and represent their views without misleading, deceiving, or otherwise impairing the clients' ability to make informed investment decisions. For more information about the FXCM's internal organizational and administrative arrangements for the prevention of conflicts, please refer to the Firms' Managing Conflicts Policy. Please ensure that you read and understand our Full Disclaimer and Liability provision concerning the foregoing Information, which can be accessed on the website.

DOTUSD Potential for Bullish Continuation| 26th January 2023Looking at the H4 chart, my overall bias for DOTUSD is bullish due to the current price being above the Ichimoku cloud, indicating a bullish market. With price tapping into my buy entry at 6.124, where the overlap support and 23.6% Fibonacci line is, we are looking to take profit at 7.415, where the previous swing high is. Stop loss will be placed at 5.704, where the previous overlap support is.
Any opinions, news, research, analyses, prices, other information, or links to third-party sites contained on this website are provided on an "as-is" basis, as general market commentary, and do not constitute investment advice. The market commentary has not been prepared in accordance with legal requirements designed to promote the independence of investment research, and it is therefore not subject to any prohibition on dealing ahead of dissemination. Although this commentary is not produced by an independent source, FXCM takes all sufficient steps to eliminate or prevent any conflicts of interest arising out of the production and dissemination of this communication. The employees of FXCM commit to acting in the clients' best interests and represent their views without misleading, deceiving, or otherwise impairing the clients' ability to make informed investment decisions. For more information about the FXCM's internal organizational and administrative arrangements for the prevention of conflicts, please refer to the Firms' Managing Conflicts Policy. Please ensure that you read and understand our Full Disclaimer and Liability provision concerning the foregoing Information, which can be accessed on the website.

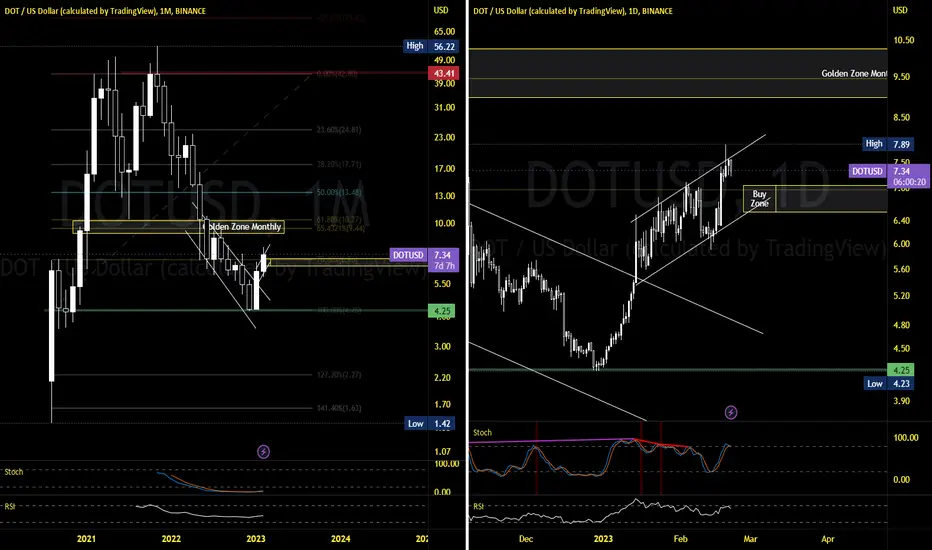
DOT - Upcoming Opportunity 2.0First things first, I had to simplify a lot of counts in Polkadot for this analysis because some of the movements are much more complex than in VeChain or Solana. The Macrocount and especially the large C-Wave (Yellow - 2D Chart) are affected, if someone wants to see the complex version just write me a message.
Polkadot is one of the more interesting projects out there and is one of the few coins that managed to establish an overshooting (B) Wave last November. Additionally, this coin attracted a lot of momentum in the last bullrun and seems to be another candidate who could survive this bear market.
Nevertheless, Polkadot crashed since last November and lost almost 92% of its value, there are coins who suffered even worse but overall, that’s an impressive loss. We choose to share our macrocount in polkadot which is just like I said before a heavily simplified long-term view.
Now to the good news, the coin managed to gain more than +55% in the last weeks and I estimate that we established a well-structured bullish impulse. In the next hours, I anticipate that the price will advance further and should end the whole bullish wave (i) impulse. The trend should shift in the next days, and it’s very likely that the next days or weeks will be dominated by wave (ii).
As in all other coins, I highlighted our blue buy zone on the chart, which ranges from 4.23$ - 6.56$. The price should enter this zone and new investors can take this opportunity to accumulate coins. After this correction, the price has only one goal, to build up massive momentum and break above the last high and finally 8$.
We will continue to build up long positions in the blue Fibonacci zone too!
Same as in Vechain, there is still a chance that Polkadot could expand further to the downside, but this really depends on how Bitcoin and Ethereum behave in the upcoming correction.
Please notice that we are already invested Polkadot since the 29th of July, back then we announced our first positions here on tradingview .
Read the full statement here:
If you should have any questions whatsoever, you can write a comment or contact me directly!
Long Polkadot (DOTUSD)
AVERAGE EXECUTION PRICE: 7.33
STOP-LOSS: NONE
LONG TERM TARGET: 55$ and more!


DOTUSD (4H) - Bearish reversalHi Traders
DOTUSD (4H Timeframe)
Waiting for the downward break of 5.60 support level which will complete a bearish trend reversal pattern to go SHORT. Only the upward break of 6.21 would cancel the bearish scenario.
Trade details
Entry: 5.60
Stop loss: 6.21
Take profit 1: 5.27
Take profit 2: 4.88
Score: 4
Strategy: Bearish reversal
