DOT up move before correction Polkadot seems it will have a short burst up before another correction wave down into the low of the accumulation zone.
The last leg of the impulse wave has aligned nicely with the Heikin ashi doji which has also retested a previous doji. Oversold stochastic along with a slight retrace suggests a possible move up into the final point of the impulse wave.
DOTUSD trade ideas


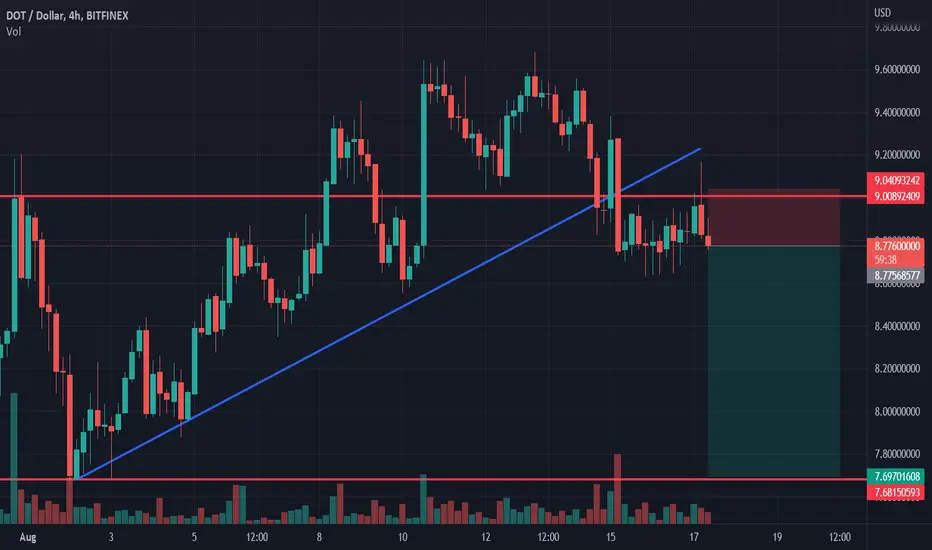
Polkadot shortPolkadot broke trough the ascending trendline. Asset broke trough the support level. Bearish movement to support level at 7.7 is possible.
DOTUSD - Falling Wedge Falling Wedge leading to a strong pattern break out
Below is an example of a similar Falling Wedge however on a different coin (NEO)

DOT / USD DAILY CHART Something for me to remember and pay attention to. reference purpose only. Jesus Loves you.

PolkadotSemi strong looking here
Obv way stronger than current pa
Sign of things to come?
Risk on looking like relief and potential continuation back to old supply zone
Cpi data was decent (better than previous)

Long DOT After a tough bear market we finally are getting a nice relief rally. Bullish Divergence on 3D+ TF, and solid Fibonacci support Levels. I believe we can reach some resistances above before going back down.

🎲 #DOTPERP - LONG - #SCALP #IDEA 🎲🎲 #DOTPERP - LONG - #SCALP #IDEA 🎲
Risk
- Medium-High
Entry Conditions:
- Broken 2 key resistances with high volume
- Expected retrace is on the cards so aim for lower entry if possible
News Source:
- N/A
Entry: $9.353
Take Profit 1: $9.789
Take Profit 2: $10.571
Stop-Loss: $8.838

POLKA DOT SHORT TERM BUY SIGNAL BINANCE:DOTUSDT
This is experimental short term polka dot signal. on a lower timeframe polka dot has flashed descending broadening wedge pattern.
You could go long with low risk make sure do not play with high leverage. as leverage is always very risky and exchange could manipulate the market to liquidate the positions. so be careful with leverage trading.
disclaimer: do not put trades on leverage always use spot trading or only go for 2x 3x leverage. crypto is already so volatile that it doesn't need leverage trading.

DOTUSD 07 AUG 2022 1010 hrsLooks like hit hit a lot of stopping volume. In VSA you could say that t was accumulating off of the "demand line" (circled). On the lower time frames you will be able to make out the uptrend with a bit more detail. Probably too high to long from here. Could use a bit of a pull back before looking for a re-accumulation pattern since it is intersecting with the "supply line". But what does the volume indicate at the supply line? Is the pressure high or will it be able to break through?
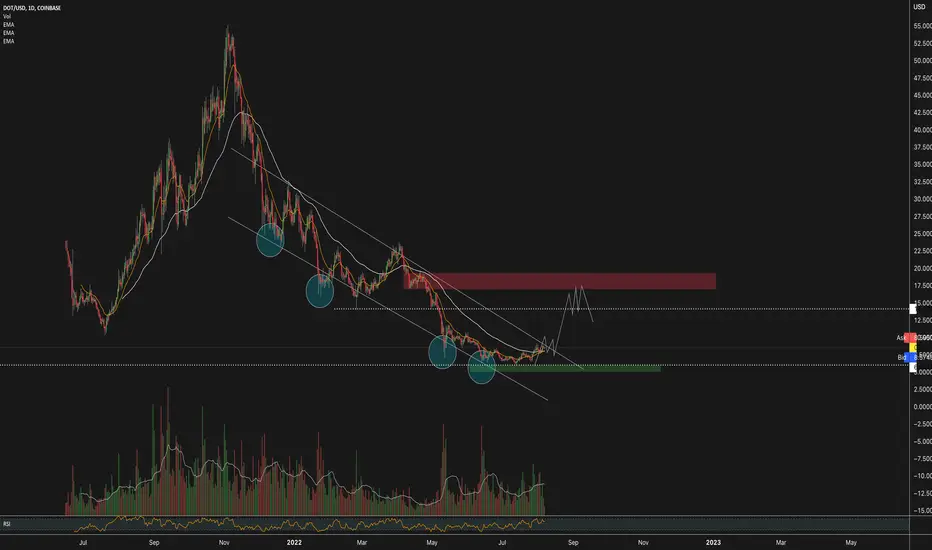

Polkadot: 77% rally incoming.Hello all. Looking at DOTUSD on the daily chart, we see the price of polkadot inside a rising channel, and currently sitting at a point of resistance at the current $8.75 price level.
While the support of this channel is at $7.14 which is a 20% lower price, the next biggest resistance sits at $15 which is a potential 77% gain.
If the price breaks the current resistance and hits the fib golden pocket at $9 .50 I will expect a rally all the way up to $15.
Retest levels to keep an eye on: 51 Day EMA, Support of the channel at $7.14, 100% fib level at $11.9.
Thanks for reading, and stay tuned. Enjoy.

DOTUSD ❕ held above the rangePolkadot consolidated above the range.
Price entered the bullish RSI zone on the 4H Timeframe.
I think the asset is slightly overbought, so I see an entry point above the resistance level, which the DOT recently broke through. After that, I think the asset will continue to rise.

DOT - RANGE TO PLAYDOT at big resistance. One more little push up or not and think we will have lgo down. If we lose 6.3 usd another support is around 4.6 where could be our bear market bottom.

Polkadot - Short Swing Trading Idea - 3 August 2022KRAKEN:DOTUSD in next three days I expecting the price to take off at least 10% to levels over $8.80. In higher time frames and in 1-2 months period we really can expect a big move to over $11.00 from current levels.
What is the supported thesis technically for the expected scenario on DOT?
- By Elliot waves we are in A-B-C correction and at this moment it's C
- Almost 60% correction and forming of good price action indications
- Test on downside of the channel and once the price enter again in channel will rocket
If you have any questions related to this trading idea I will be happy to provide you with answers.

DOTUSD Potential for Bearish Continuation | 2nd August 2022On the H4, with price breaking the ascending channel , we have a bearish bias that price might drop from our buy entry at 7.53, which is in line with 100% projection and 61.8% fibonacci retracement to the take profit at 6.57, which is in line with overlap support and 161.8% fibonacci projection . Alternatively, price may rise to our stop loss at 9.03, which is in line with the swing high. Take note the 8.02 could be our intermediate resistance, which is in line with the 78.6% fibonacci rertracement.
Any opinions, news, research, analyses, prices, other information, or links to third-party sites contained on this website are provided on an "as-is" basis, as general market commentary, and do not constitute investment advice. The market commentary has not been prepared in accordance with legal requirements designed to promote the independence of investment research, and it is therefore not subject to any prohibition on dealing ahead of dissemination. Although this commentary is not produced by an independent source, FXCM takes all sufficient steps to eliminate or prevent any conflicts of interest arising out of the production and dissemination of this communication. The employees of FXCM commit to acting in the clients' best interests and represent their views without misleading, deceiving, or otherwise impairing the clients' ability to make informed investment decisions. For more information about the FXCM's internal organizational and administrative arrangements for the prevention of conflicts, please refer to the Firms' Managing Conflicts Policy. Please ensure that you read and understand our Full Disclaimer and Liability provision concerning the foregoing Information, which can be accessed on the website.

DOTUSD Potential for Bearish Continuation | 2nd August 2022
On the H4, with price breaking the ascending channel , we have a bearish bias that price might drop from our buy entry at 7.53, which is in line with 100% projection and 61.8% fibonacci retracement to the take profit at 6.57, which is in line with overlap support and 161.8% fibonacci projection. Alternatively, price may rise to our stop loss at 9.03, which is in line with the swing high. Take note the 8.02 could be our intermediate resistance, which is in line with the 78.6% fibonacci rertracement.
Any opinions, news, research, analyses, prices, other information, or links to third-party sites contained on this website are provided on an "as-is" basis, as general market commentary, and do not constitute investment advice. The market commentary has not been prepared in accordance with legal requirements designed to promote the independence of investment research, and it is therefore not subject to any prohibition on dealing ahead of dissemination. Although this commentary is not produced by an independent source, FXCM takes all sufficient steps to eliminate or prevent any conflicts of interest arising out of the production and dissemination of this communication. The employees of FXCM commit to acting in the clients' best interests and represent their views without misleading, deceiving, or otherwise impairing the clients' ability to make informed investment decisions. For more information about the FXCM's internal organizational and administrative arrangements for the prevention of conflicts, please refer to the Firms' Managing Conflicts Policy. Please ensure that you read and understand our Full Disclaimer and Liability provision concerning the foregoing Information, which can be accessed on the website.

DOTUSD Potential for Bullish Continuation | 1st August 2022On the H4, with price moving along the ascending channel, we have a bullish bias that price might rise from our buy entry at 8.99, which is in line with pullback resistance to the take profit at 9.91, which is in line with overlap resistance and 161.8% fibonacci projection. Alternatively, price may drop to our stop loss at 8.18, which is in line with the 38.2% fibonacci retracement and 78.6% fibonacci projection .
Any opinions, news, research, analyses, prices, other information, or links to third-party sites contained on this website are provided on an "as-is" basis, as general market commentary, and do not constitute investment advice. The market commentary has not been prepared in accordance with legal requirements designed to promote the independence of investment research, and it is therefore not subject to any prohibition on dealing ahead of dissemination. Although this commentary is not produced by an independent source, FXCM takes all sufficient steps to eliminate or prevent any conflicts of interest arising out of the production and dissemination of this communication. The employees of FXCM commit to acting in the clients' best interests and represent their views without misleading, deceiving, or otherwise impairing the clients' ability to make informed investment decisions. For more information about the FXCM's internal organizational and administrative arrangements for the prevention of conflicts, please refer to the Firms' Managing Conflicts Policy. Please ensure that you read and understand our Full Disclaimer and Liability provision concerning the foregoing Information, which can be accessed on the website.

DOTUSD Potential for Bearish Rise | 29th July 2022On the H4, with price moving along the ascending channel, we have a bullish bias that price might rise from our buy entry at 8.00, which is in line with pullback resistance to the take profit at 8.49, which is in line with overlap resistance. Alternatively, price may drop to our stop loss at 7.50, which is in line with the 38.2% fibonacci retracement.
Any opinions, news, research, analyses, prices, other information, or links to third-party sites contained on this website are provided on an "as-is" basis, as general market commentary, and do not constitute investment advice. The market commentary has not been prepared in accordance with legal requirements designed to promote the independence of investment research, and it is therefore not subject to any prohibition on dealing ahead of dissemination. Although this commentary is not produced by an independent source, FXCM takes all sufficient steps to eliminate or prevent any conflicts of interest arising out of the production and dissemination of this communication. The employees of FXCM commit to acting in the clients' best interests and represent their views without misleading, deceiving, or otherwise impairing the clients' ability to make informed investment decisions. For more information about the FXCM's internal organizational and administrative arrangements for the prevention of conflicts, please refer to the Firms' Managing Conflicts Policy. Please ensure that you read and understand our Full Disclaimer and Liability provision concerning the foregoing Information, which can be accessed on the website.

POLKADOT Coin convergence pattern identifiedMACD Convergence is an high success signal.
This coin is a long time investment for me, 5x + of capital


DOTUSD Potential for Bullish Rise | 28th July 2022On the H4, with price breaking the descending channel, and showing a bullish flag pattern, we have a bullish bias that price might rise from our buy entry at 7.52, which is in line with pullback resistance to the take profit at 8.46, which is in line with overlap resistance. Alternatively, price may drop to our stop loss at 6.55, which is in line with the swing low support.
Any opinions, news, research, analyses, prices, other information, or links to third-party sites contained on this website are provided on an "as-is" basis, as general market commentary, and do not constitute investment advice. The market commentary has not been prepared in accordance with legal requirements designed to promote the independence of investment research, and it is therefore not subject to any prohibition on dealing ahead of dissemination. Although this commentary is not produced by an independent source, FXCM takes all sufficient steps to eliminate or prevent any conflicts of interest arising out of the production and dissemination of this communication. The employees of FXCM commit to acting in the clients' best interests and represent their views without misleading, deceiving, or otherwise impairing the clients' ability to make informed investment decisions. For more information about the FXCM's internal organizational and administrative arrangements for the prevention of conflicts, please refer to the Firms' Managing Conflicts Policy. Please ensure that you read and understand our Full Disclaimer and Liability provision concerning the foregoing Information, which can be accessed on the website.

Long Polkadot (DOT) vs USDTDOT finally found floor at $26. This area had to be tested as support once again and now it's ready to challange the ATH's IMO.
DOTUSDT is testing MA200 from below and as long it trades above it and flips it to support, I'm bullish on DOT.
This is an aggressive entry here, more convention entry would be once it flips $33 to support.
One of my favorite crypto project out there that hasn't shown it's true potential yet. It's a Top 3 project IMO.
Make sure to take profits on the way up.
Good luck.
