DOT/USD LONG IDEADOT/USD LONG IDEA
DOT/USD has broken into our Buy Zone Area we now looking for low prices to Buy up towards our Daily Target of 27.87917600
A nice up channel has formed and we going to use it as Support Resistance Levels to guide us to put Take profit levels identified .
TP1 : 27.87917600
TP 2 : 25.32764000
SL : 13.79581645
DOTUSD trade ideas

DOT bull Run set upDOT Bull Run soon , May and April will be big months for crypto Lets goooooooo Lets make this MF money

DOTUSD Similar to other Crypto which is viewed as 'RISK-ON' asset DOTUSD seems ready for further bear pressure

Game plan for DOT _ Target $ 30 _ The DOT is likely to be in the area around $ 30 on May 13 and there is a high risk of correction and the end of the crypto cycle.
Only closure over a given area can invalidate this plan.
Not the financial board.
Just for fun.

DOT/USD: Trend line lower highPolkadot forming a nice trend line lower high since $16.12 USD in the date of March, 07, 2022 and we see an uptrend. Also, you can to put a buy now and SL to $20.20 USD and target to $26 USD. Also, the target toward $24 USD could be good if in case that DOT doesn't reach the $25 USD or we see any correction toward this trend line.
So guys, it's very easy we see that Polkadot forming a lower high in this market structure.
This it's the H8 timeframe and I see a bullish structure from this timeframe.
This will be a risk/benefit of 1:2
Good luck!!!

Bullish reason for DOTUSDThe rebound has hit DOTUSD.. and made a bullish to make a reversal turn. The dip found the really strong support from 20-21 area, has made the bulls to make the turn to keep going up and broke the resistance from the recent break. The bulls should upward sideways and maintain the recent highs and then go higher.
Target is 100$ For 2022 .. if the highs surpass then we will see about 150. Good luck y’all don’t forget to buy this at Coinbase

Long DOT on Daily closeLet's Long on a daily close above horizontal resistance.
Targeting 200D.
RR 2/1

DOT - Fighting at resistanceWe have reached the VERY STRONG 23.50 resistance, which was the previous broken neckline of the large H&S.
Bears have reacted and we could se a retest of the gray rising trendline.
In the chart I´ve posted my bullish (purple) and bearish (blue) scenarios.
At this moment I´m not taking any trades, waiting for more clarity on price action.

DOT USD ANALYSISPolkadot has a nice healthy bullish trendline which is holding. When we break this resistance, we can go to $27. Just watch EMAs and volume.

DOT 274% up by June 2022Polkadot developers are working hard in their project.
We can discover how the chart is showing us a mathematical repetition.
Will this repetition happen again? Most likely yes, in my opinion.
A new alt season is starting.
DOT started to break and its fundamentals are very strong.
I draw 3 vertical RED lines when a new high is expected.
Since it started to break I draw a green temporal sequence of 103 days. The 106 days drop. I copied and pasted the time sequence.
The yellow arrows are also copy and paste, they all have the same degree of inclination and length.
We can see DOT is at the 3rd retest at a very low level and it will start climbing until hitting $63. By having a current price of $23, this means DOT will have an increase of 274%.
Thank you for clicking like.
Happy trading,
Raf


DOT/USD: Weekly outlookPolkadot it's showing us a strengthen in this bull trend that we could to find up during next weeks a upside trend. This it's a quickly shortly analysis of my weekly outlook and I have that DOT it's look bullish from the previously candlestick in this timeframe.

A Giant Bullish Divergence DOTUSD This is a bullish divergence seen on the Weekly chart
Very bullish sign for DOT

DOT moonboysEveryone is sleeping on this giant. Eth who? Parachain is the future clearly, thats why gavin left to pursue it. Price target of $300 is going to seem unreasonably small once the full potential of this beast is unleashed in a few seasons. A long way back to the top but once momentum flips and trend starts to head upwards sky is the limit for this pup. Shorter term more realistic prices are marked. Good luck traders.

DOT Sign of Strength RallyThe DOT price has been observed in a horizontal re-accumulation trading range from Jan 21, 2022 to the present. The DOT price is pushing up against the trading range resistance in what appears to be an SOS rally.
I will make a long entry in this presumed SOS rally (around $21.5) and take profit around the next resistance cluster around $28. I may add to the position at the BU/LPS.
The upper and lower boundaries of the re-accumulation trading range are given by the horizontal black lines. Blue arrows mark volume spikes.
Wyckoff abbreviations: automatic rally (AR), change of character (CHoCH), sign of weakness (SOW), failed upthrust (FUT), selling climax (SC), sign of strength (SOS), back up (BU), last point of support (LPS), last point of supply (LSPY).
This is not financial advice. I am not your financial advisor. This is my opinion.

DOT/USD - Potential 85% SetupHello Traders!
The DOT began to accumulate in the $15.90 - $23.00 range after the end of the correction
The price has consolidated above MA100 on the daily timeframe and is testing the upper boundary of the accumulation range, the level of $23.00
Entry into short-term purchases can be looked for in the range of $20.75 - $23.00
Consider exiting by stop-loss in case the price goes below $17.00
The targets will be price levels of
$30,00
$34,40
$39,00
Good luck and watch out for the market
P.S. This is an educational analysis that shall not be considered financial advice

DOT is ready to reverseDOT has cleared the trendline and is forming IHS pattern and should run to test $21-$23
Once the neckline is clear at $23 that should push to complete IHS up to $32 range.
Good Luck

DOTUSD D1: 500%+ gains THE BEST Level to BUY/HOLD (SL/TP)(UPDATEWhy get subbed to me on Tradingview?
-TOP author on TradingView
-2000+ ideas published
-15+ years experience in markets
-Professional chart break downs
-Supply/Demand Zones
-TD9 counts / combo review
-Key S/R levels
-No junk on my charts
-Frequent updates
-Covering FX/crypto/US stocks
-before/after analysis
-24/7 uptime so constant updates
🎁Please hit the like button and
🎁Leave a comment to support our team!
DOTUSD D1: 500%+ gains THE BEST Level to BUY/HOLD (SL/TP)(UPDATE)
IMPORTANT NOTE: speculative setup. do your own
due dill. use STOP LOSS. don't overleverage.
IMPORTANT NOTE: read entire idea before
execution. Tagged as BULLISH because I expect
reversal after pullback.
🔸 Summary and potential trade setup
::: DOTUSD D1 chart review
::: chart looks good /strong
::: HOWEVER short-term
::: expect mild PULLBACK
::: setup still valid as of right now
::: previously massive BULL TRAP after
::: FAILURE to break CYCLE HIGH
::: get ready to BUY LOW later
::: expecting BEAR TRAP near 20USD
::: i.e. FAKE BREAKDOWN of key S/R
::: best reload bulls near 20USD later
::: expecting 500% bull run
::: re-test of sliding S/R line
::: near 100 USD later
::: BULLS stay out be ready later
::: expecting short-term correction
::: BULLS get ready to BUY after CORRECTION
::: TP bulls is +1000% gains later
::: expecting decent gains soon
::: 20-25% PULLBACK short-term
::: recommended strategy: BUY/HOLD after CORRECTION
::: TP BULLS +500% gains / 100 USD
::: BEST reload BULLS near 20 USD
::: TP BULLS is 100 USD final EXIT
::: SWING TRADE: BUY/HOLD IT
::: bull run not over yet
::: good luck traders!
::: BUY/HOLD and get paid. period.
🔸 Supply/Demand Zones
::: N/A
::: N/A
🔸 Other noteworthy technicals/fundies
::: TD9 /Combo update: N/A
::: Sentiment mid-term: BULLS
::: Sentiment short-term: BEARS/PULLBACK
RISK DISCLAIMER:
Trading Crypto, Futures , Forex, CFDs and Stocks involves a risk of loss.
Please consider carefully if such trading is appropriate for you.
Past performance is not indicative of future results.
Always limit your leverage and use tight stop loss.

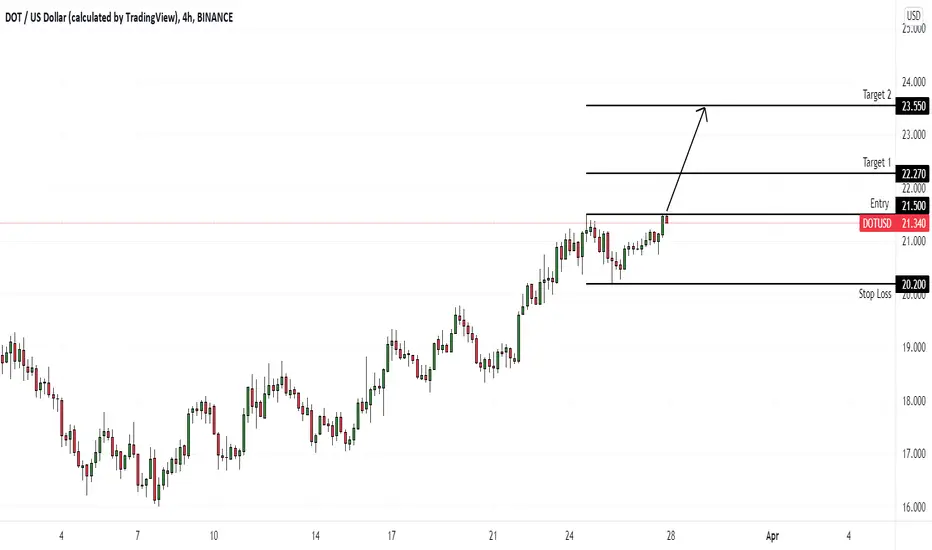
DOTUSD (4H) Bullish breakoutHi Traders
DOTUSD (4H Timeframe)
The market is in an uptrend, and we are waiting for an entry signal to go LONG above the 21.50 resistance level. Only the downward break of 20.20 would cancel the bullish scenario.
Trade details
Entry: 21.50
Stop loss: 20.20
Take profit 1: 22.27
Take profit 2: 23.55
Score: 5
Strategy: Bullish breakout
PolkaDot 2022/2023 road to $200I don't think I need to explain Dot as everyone is familiar with this project. Let's get into the targets, shall we?
T1: $79
T2: $120
T3: $200

DOTUSD has be consolidating since january2021This is among the top web3 crypto projects to watch over so carefully this year.falling wedge has be broken

Dot/UsdHello traders! For my opinion this crypto is buy.
Don`t forget to look the economic calendar!
MAKE MONEY AND ENJOY LIFE 💰
THANK YOU!
GOOD LUCK!
🙏🏻🙏🏻🙏🏻

DOT downwards channel breakoutDOT has completed a 5 wave correction sequence in a downward channel from its highs into a weekly demand zone. Its had a high volume bottom as it come into the zone and closed with a rejection wick and pinball close on weekly. The trend has started to reverse and put in a HH on the 3D having reset on the RSI from being oversold and now trading above the MA and looking like it could be the beginning of a new uptrend. Swing structure on weekly looks good, HH and HL formation so id expect the high to get taken and DOT to put in a new ATH from here based upon HTF analysis. MACD also converging showing momentum coming into the market on buyer side coinciding with new wave the the upside.
