DOTUSD BEAR! Head and Shoulders formation confirmation imminent?In the chart I have highlighted the key areas of the head and shoulders classic formation for DOT. Using a four hour candle chart, it appears that all, or at least most of the key characteristics of the pattern are present with the pattern one key step away from full confirmation. This is my first published chart, and I am not an expert quite yet on technical analysis so I am open to constructive criticism in my analysis of this pattern and my assumptions regarding it. If any of what I show or say in the chart is not correct please correct me! To the point now!- As seen in the box drawn you can see the namesake of the pattern clearly; two shoulders and a hear, with the neckline drawn at the resistance points before and after the head. The Head and Shoulders pattern is a highly effective pattern for predicting a downward shift in a securities value. The pattern must meet other criteria outside of the visual "head and shoulders" look on a chart. Other key indicators that can assist in verifying a true H&S include analysis of the trading volume as the formation unfolds. The left shoulder you will see increasing trade volume, this is text book from my research and study and also leads into the trading volume analysis within the "head and right shoulder. Trade volume is falling throughout the formation of the head and falling again throughout the right shoulder formation. From my minimal but diligent studying, these indicators must all be present for it to meet the criteria for a true H&S. Lastly, for the pattern to be truly confirmed, once the right shoulder is complete the price must break the resistance of the neckline, once this takes place a downturn is likely just a few candles away. As I am writing this the price seemed to have temporarily punched through the neck, but not to the extent that I would call it 100% confirmed, but I am fairly confident that event may be happening at this moment or will soon become a reality. If the price were to bounce and not break the neck then by definition I do not believe this would "qualify" as the H&S pattern. Thought this was very interesting and could be potentially helpful and somewhat educational for some, and hopefully I am able to help some of you out there either avoid some losses or even better, help some of you make some money via shorts. Thanks for taking a look. Please let me hear your feedback about this analysis, if it is good info/bad info/ or helped you to make or save money during a downward price move.
DOTUSD trade ideas

Moment of TruthDOT is currently reaching the very top of a 3 month down trend. RSI and CCI are in the or approaching the overbought territory. However, if it breaks out we should head to the 22.50 area. If not we should bounce of the $18.50 range and either make one more attempt to break out of the down trend or its bye bye birdie towards $15 range. Good luck. Not financial advice.


DOT - CORRECTION TILL FED'S DECISION ABOUT RATES HIKE IN MARCH?Looking for one move down for alts till FED's decison about raising rates in mid march. If we are still in bull market correction from december can be just to wait for regulators, so we can pump afterwards. In 2017 we had rates hikes three times in mid march, june and december. Everytime we corrected after decision bt finally the last one meant "game over".

POLKADOT long play intra hourI like DOT to make a run here, everything is looking ripe for one.
Check out some of my other idea's, I will keep updating this one.

DOT updateDOT revisiting its previous correction zone from the blue ABC and is currently forming a new ABC buy wave, white, with a higher level of price target.

DOT BuysIt looks like Polkadot is finally starting to acuminate after repeating the same formation it did before our previous push to ATH. I'm looking for some good holds in the coming weeks to buy as much as I can. I said it before and I will say it again. DOT will be in the 8's this next run!

Triple Bottom + Bullish DivergenceA relatively rare setup on a daily chart. DOT has recently bounced off a third bottom and coupled with a bullish divergence. I expect some upside over the next few weeks for patient souls.

DOT about to Breakdown from MASSIVE Price Channel. SHORT.These crypto charts are ALL looking various shades of UGLY.
Already traded this one earlier with SHORT from $21.79. Closed that trade and NOW SHORT again.
We are breaking down from massive Price channel of the last 2 years (Solid Think Yellow Lines). On the Daily chart we have tested this level many times and the momentum is picking up to the downside as well as all small rallies have been sold to reach support here.
I am anticipating a break of the thin yellow support line and a washout lower.
Trade what you see.

Polkadot | Weekly TimeframeThis is the last Altcoin we will look at today.
Polkadot (DOTUSD), weekly (W) timeframe.
We have the same base as the other Altcoins we looked at, namely ETH, ADA & SOL.
That is a bearish candle this week with bearish indicators.
Both the MACD and RSI are trending lower.
The mixed signals here are coming from the ascending trendline of the giant flag drawn.
The rising trend-line can work as support and the uptrend resume... If this support fails we are likely to see lower.
I also looked at the 3 Line Break and Renko charts and they are fully bearish...
We will know soon anyways.
Thank you for reading.
Wishing you a lovely Sunday.
Namaste.

The Range PlayMonday will be a defining day in are short crypto history, yet it will define the next 6 months of trading. Make clear and educated moves and we will all enjoy the outcomes
remember have fun and don't stress!

What I expect the DOTUSD do retesting the 10 dollars area What I expect the DOTUSD do is retesting the 10 dollars area forming double bottom on the week time frame since we broke the up trend line from the week time frame.

People say DOT is good. DOT is futureI don't know why people want to connect Blockchains. But they seem to want.

DOT chart makes new LL and LH, Shorting is Beneficial.i,m going to short DOT Coin because DOT chart pattern makes new LH and LL.

Possible DOT movements.DYOR. NFA.If DOT follows past performance. Most likely will not, but it is something to follow in case it does decide to have some synchronicity. I think this last BTC pump was a liquidity grab and way for exchanges to cash in on one more LONG liquidation. Following I believe we will go down to the $15-$16 range a small bounce back to $19 -$20 range and then a drop the $13-$14 range then I believe its a 2 to 3 mo bull cycle. All of this is keeping macro economic events out of it, including an S & P crash in Mar due to fed raising rates and inflation being out of control. Only time will tell. These are just wild ass guesses of course. No one knows what the future holds.

DOT - HIDDEN BEARISH DIVERGENCE - $13 DOT has created another hidden bearish divergence on the daily chart with another move below 50 on the RSI
this combination has not treated traders very well on this down trend. looking for more downside in DOT
not trading advice
tg

Pokadot long ideaWhat does everyone think, i believe the bleed is over and is time to make some money

Buy MTF Polkadot!Polkadot has clearly broken out of its downtrend we are buying dips near the red lines... Divergences on the RSI as well. HODL if you are all in.

Polkadot Analysis
Polkadot is an open-source sharded multichain protocol that connects and secures a network of specialized blockchains, facilitating cross-chain transfer of any data or asset types, not just tokens, thereby allowing blockchains to be interoperable with each other. Polkadot was designed to provide a foundation for a decentralized internet of blockchains, also known as Web3.
I think a great buy would be below the $10 dollar price - preferably around $7 dollars.

DOT Diem fundamentals dissolve, more bullish on SOL nowTo keep this short, it's now very public knowledge that Diem is no longer being pursued by FB and therefore the fundamentals have decreased for DOT. I still remain bullish on DOT but this is likely going to play out over a longer period of time. I would diversify into market leaders like SOL in the meantime and get some exposure to this top project as I've spoken to some developers and they speak about the ease of use with Solana's programming language which is a game changer in terms of onboarding legacy developers into the crypto world.
Here's my latest post on SOL:

Polkadot Buy Opportunity (Idea) <$10As you may have seen with my other published idea on BTC. I'm anticipation BTC to fall to $20 to $25K as target for a 'potential' buying idea. If this does occur, it therefore supports this idea of seeing Polkadot fall to the $8 to $10 dollar range (possibly lower). Lastly, the BTC idea supports by other idea on Solana.
My analysis clearly consist of a clear degree of inter-market analysis.
Feel free to engage and share your thoughts in the comments.

dot finishingdot breaks out of downtrend
Break through the pressure of the platform
Short-term expected shock upward
Follow me to take you to achieve financial freedom

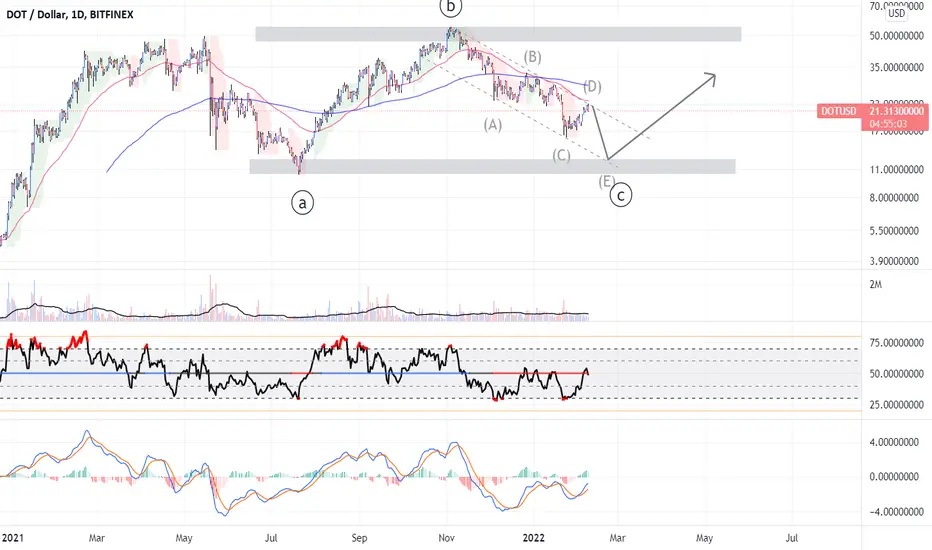
DOTUSD CorrectionHey folks, I hope you are having a wonderful day so far!
DOTUSD seems to be forming a big ABC correction pattern along with an ABCDE correction pattern. The breakout will be very bullish and it will be a pretty good long-term trade! Short term wise, I would personally short it and wait for the price to reach pattern E.