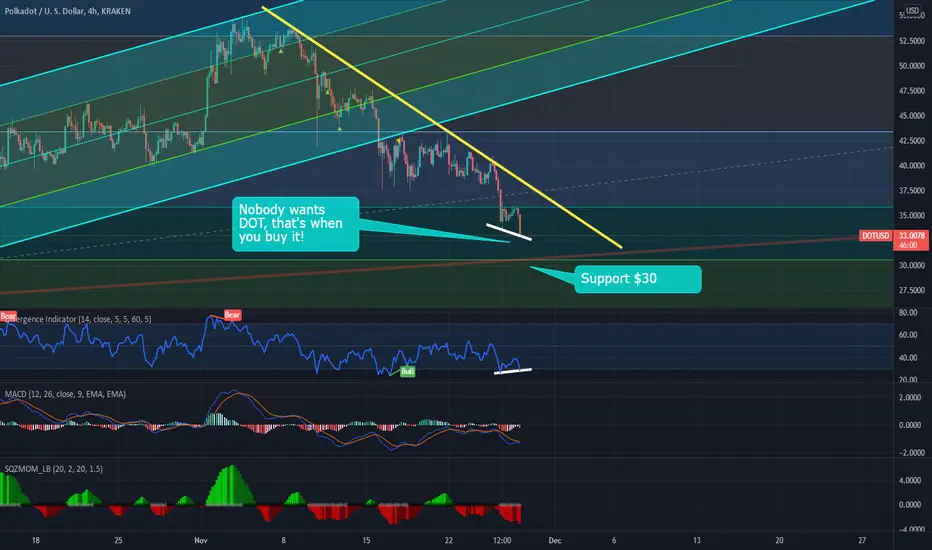
DOT Who wants it?Well, DOT has had no love for a long time. Is this the bottom? Depends on BTC
DCA now would be a great way to add DOT. Support is close but what a drop. Maybe we can all ride this one back up again and reach $75-$100.
Good Luck
DOTUSD trade ideas
DOTUSD 26/11Weekly:
Bullish M
Daily:
inv h&s, double bottom
4H:
Bullish M (IC) + inv h&s
Had misschien moeten wachten op de daily close, want nu breekt prijs niet de vorige low . 4h was echter al bullish na de tap van de daily zone dus was goeie trade

Latest Look at DOTBased on historical data alone I see two outlooks for DOT. Either an upward trend to $55/coin by 18 December or a continuation of a downward trend to a range of $14-$20 on 9 February. Again, just learning here. Trying to find new ways to analyze trends. Any ideas on how to improve this would be great. Obviously there are outsider influencers at work with recent trends that do impact this analysis. Would be great to hear how others counter these influences!

POLKADOT LONGS ✅✅✅Expecting the price to make another leg to the upside way above buy side liquidity (BSL) printing probably new ATH's. We are in a bullish market structure, price just made a retracement move back into bullish orderblock h4 + imbalance fill near 35.00 which is a psychological barrier for this cryptocurrency.
Always use stops and control the risk !

DOT value depreciates below $34 as bears continue winningThe market has been following a bearish trend for the past few weeks as the bears have been securing wins consecutively. The price underwent a significant decline in the last 24-hours as well because of the sudden rise in bearish momentum. The latest downtrend has decreased the coin value to $34, which has left a pretty negative impact on the market value of DOT/USD.

Is DOT perhaps in Elliott Wave 3 of an impulsive move?I'm not a financial advisor, not giving financial advice. This is my first published idea on TV, and I'm doing it primarily to learn rather than teach/explain. I'm still getting comfortable with counting Elliott Waves, but so far, I think I have a good sense for it. With that said, I hope you'll read this description and share your thoughts on what I've proposed...
I went to chart DOT against Elliott Wave theory on the weekly, originally thinking it was in wave 4 of an impulsive move (like I've counted BTC and many other coins to be in). So I went to the daily chart to count the "minute" daily waves within each weekly "minor" wave, but I couldn't find a verifiable 5-wave minute impulsive structure to fit inside of the minor impulsive wave 1. Which means I need to recount (can't force it).
So I got to thinking...maybe DOT isn't currently in wave 4, it's in wave 3 ?? (!!!!!)
Here's my wave count on the weekly chart:
- You can see wave 2 retraces to just past the .786 Fib level from the beginning of wave 1
- The lengths of waves 3 & 4 were determined using Fibonnaci levels as well, with the length of wave 3 = 1.618 x length of wave 1, and wave 4 = .382 retracement level from beginning of wave 3
*above measurements all fall within reason under Elliott Wave theory
It's a little messy, but you can also see the relationship the price action has with the 20 MA (colored green or red based on whether price is above or below it). Price stayed above 20 MA for all of wave 1. Wave 2 was triggered as price moved below the 20 MA. And now wave 3 has traded above the 20 MA until today, where it looks to be barely holding the line. It will be interesting to see if this weekly candle closes above or below the 20 MA. A close below followed by continued downward movement could negate my wave count.
Also take note of the upward trend on the RSI 14 that started back in May.
Would love to hear thoughts from other Elliott Wave charters. Are my counts reasonable or do you see it differently?


Great long term entries for $DOT56% from all time high is a steal! Polkadot is a phenomenal project in its parachain auction process. I will be adding to my long-term bag here.

DOTUSD❗ Focus on 33.6406 ⚡For the DOTUSD coin, a further fall is expected within the downward channel. The level of 33.6406 is the target of the fall, and a breakthrough of this level is also expected.
Have a nice trade!
Your Solldy.

DOTUSD expanding more another ATH?Polkadot could settle up another ATH, right now which is at an important level to hold.

POLKADOT YEAR END PROJECTIONPOLKADOT seems to be respecting the trend lines
Along with the fib retracement
bullish target at $72
If history repeats itself
Let me your thoughts in the comment section

Classic Elliot Wave for DOT?Daily Chart, classic Elliot Wave pattern. Possible pump could be powerful.

current state of the market 1 1 / 2 4 / 2 1looking for additional buys inside marked areas. if broken and dumped below, accumulate. Could this be the crypto winter? Don't think so, im an optimist, but we shall see... observe the masses and do the opposite


DOTUSD BuyPrice appears nestled between a daily support and its uptrend, making this a nice pickup. RSI curling up too means this may see another leg up. $45 could be a quick swing, but I think we could see a retest of ATH.

DOT Now What?For DOT to regain entry into the Pitchfork, there should be some resistance at the lower level.
Shows potential double bottom support fib around $38
RSI may encounter resistance before breakout.
MACD and Squeeze may slowly build momentum to move up?
Appears consolidation may occur between $38 and the YELLOW descending trend line until a breakout occurs.
Until BTC decides where crypto is going in the short term DOT will range.
Good Luck

DOT uPDOT has been nicely accumulating the red area... a nice breakout out of the box will definitely make a floor of this area.
I'm expecting the first upside to be around 15%+ to the nearest resistance area. I would bet on starting to accumulate here, as we may have more gains in near future.

It's time to load up on Polkadot!Hello everyone! It's been a while since a major correction on $DOT. What a bull run, huh? $DOT was up as much as 410% since it's lows in mid-July. So should you go ahead and get some now that it is down 20% from its initial highs, or should you shave off these gains? I'm here to help you out.
Technical analysis
$DOT has formed a beautiful uptrend which continues to show signs of strength. Given the fact that crypto went mainstream, I think that such a promising coin with a lot of innovation has quite a chance of reaching new all-time highs. ( Currently, Polkadot is 8th biggest cryptocurrency in the world by market cap )
Innovation behind Polkadot
Relay Chain: The base Polkadot chain is the relay chain that connects all these individual chains. As such, they can organically solve interoperability issues between these connecting chains.
Parachain: This stands for parallelized chains that run through the Polkadot network. These help scale up the system by parallelizing operations.
Bridge Chain: This chain connects different blockchains that don’t use Polkadot’s governance protocols.
Trading plan
The general idea behind an uptrend is to buy at the support zone and sell at the resistance zone. And that's what I want you to do. I think it's a great time to enter a long position. In case of a breakout to the downside, use a stop loss. I would recommend setting it 3-5% bellow your entry price. Hope this helps. Feel free to leave a comment down below. See you soon, in the next one!

dot long swing ~similar scenario as my last 2 posts, dot has a daily algorithmic buy signal starting to flash, will confirm at todays close.
i believe dot is in a deep sub-wave 4 here, and it's got one last leg to go, similar to btc.
my upside target for this sub-wave 5 = $64
it could break before then, so take profit along the way as needed.
keep an eye out for updates just in case something ends up changing.

DOTUSD - Update to Long-Term Channel with Battling ArcsIn my last analysis, I said that if DOT breaks back into the smaller bearish arc after breaking out and then retesting, it would invalidate my target of $95-120 by year's end.
That invalidation happened in the last dip, and today we see a possible second break to the upside of the smaller bearish arc, putting the original bullish scenario back into play.
I extended the parabolic arc out a bit, and both scenarios are still in play. I would look for $50+ as a confirmation of the upside target, and a failure to regain $50 in November as a confirmation to the downside.
My bias is still bullish on the crypto market and DOT in particular. I'm looking for a break of $50 by the end of the month and a fast move upwards towards $95+ thereafter.
Good luck and enjoy.

DOT UPDATE!Like i posted earlier on DOT getting closer to my take profit target $44... funny enough i missed the trade

DOTUSD (4H) Bullish reversalHi Traders
DOTUSD (4H Timeframe)
Waiting for the upward break of 43.02 resistance level, which will complete a bullish trend reversal pattern to go LONG. Only the downward break of 37.32 would cancel the bullish scenario.
Trade details
Entry: 43.02
Stop loss: 37.32
Take profit 1: 46.37
Take profit 2: 52.07
Score: 5
Strategy: Bullish reversal
