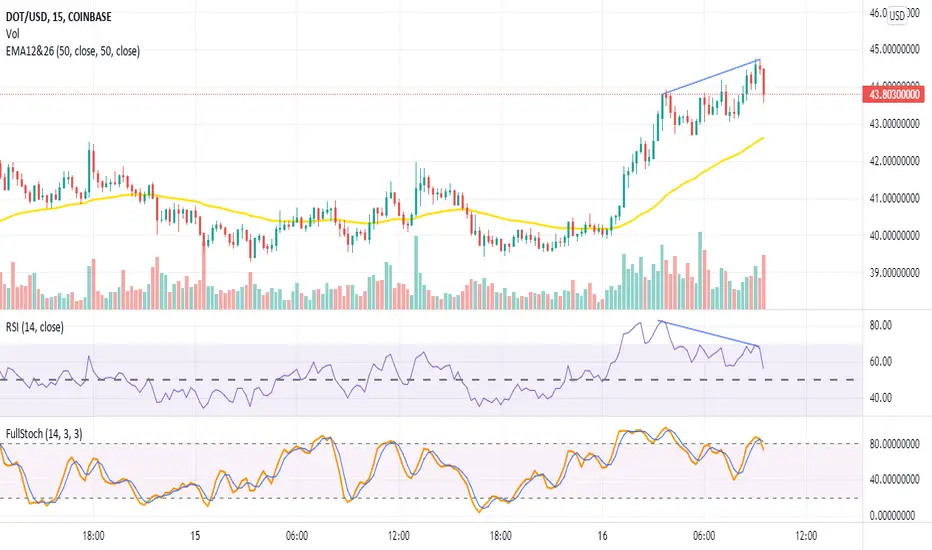
DOT pullback, going back to 39 zone?Rally not convincing as per RSI and Stochastic crossing over. Needed some pullback before it continues to go up.
What's your take guys? 39 or 50 ?
DOTUSD trade ideas

DOT Bullish potentialDOT broke the 38.5$ / 40$ resistance with volume, MACD Wk and MACD Daily are looking good.
Anything between current price and 38.50$ should be seen as buying opportunity to target 50$ region.
On the other hand, if we break back down the EMA4 and the zone we could see a retracement down to 32$.
My Bias would be to go long on this coin as long as 38.5$ is not broken in daily.

Bearish Cypher on PolkadotI suspect this will reverse in a similar way to algo my short zone is in between the .786 and .886


Polkadot DOTUSD Elliott waves projectionAnalysis based on Elliott waves projection
Black lines are for exiting your positions gradually

DOT Just want to share my TA with the community and get feedback if possible, what do you guys think about this potential inverted head and shoulders on DOT? KRAKEN:DOTUSD

Chapter 1 of the DOT Story - Polkadot Parachains Polkadot is just really getting started. Today the parachains were announced and the PA reacted instantly.
A famous saying goes "show me the charts, I'll tell you the news".
Well right at the end of a near perfect cup n' handle, parachains were announced. Coincidence? Fibonacci? Random word to sound smart yet mystic-like?
Whether you buy in now or the retest around $37-$40, this is your choice. But 5-10 years down the line when 1 DOT token will be valued over $10,000, you are not going to care whether you bought the retest or not.
$10,000 how? Simple. Polkadot is a layer 0 solution. It is naturally going to solve every other blockchain's problems of scalability vs speed vs decentralisation with its parachains. Don't be surprised if we see a Solana or an Ethereum bidding for a parachain someday to fix their own issues that won't be solved by their (dare I say) centralised base layers.
If there is 1 token that will not only overtake ETH, but overtake BTC, I have my money on DOT. Assuming of course nothing drastic happens to their code.
Why?
DOT's utility is made to drive the price up. When the community are leasing DOT tokens for up to 2 years at a time - multiply that by 100 (for the number of parachains) and then add the fact there will be a large chunk put into staking for governance and, furthermore, DOT's that will be in corporations and countries' balance sheets/crypto reserves, what's left is a very little supply of DOTs left circulating for us.
Let history remember this.

DOTUSD - Polkadot's road to recovery point 50Interval: 4hrs
Description: Polkadot shows substantial recovery toward the resistance line of $42. And after that bulls should easily can get to recovery point 50.

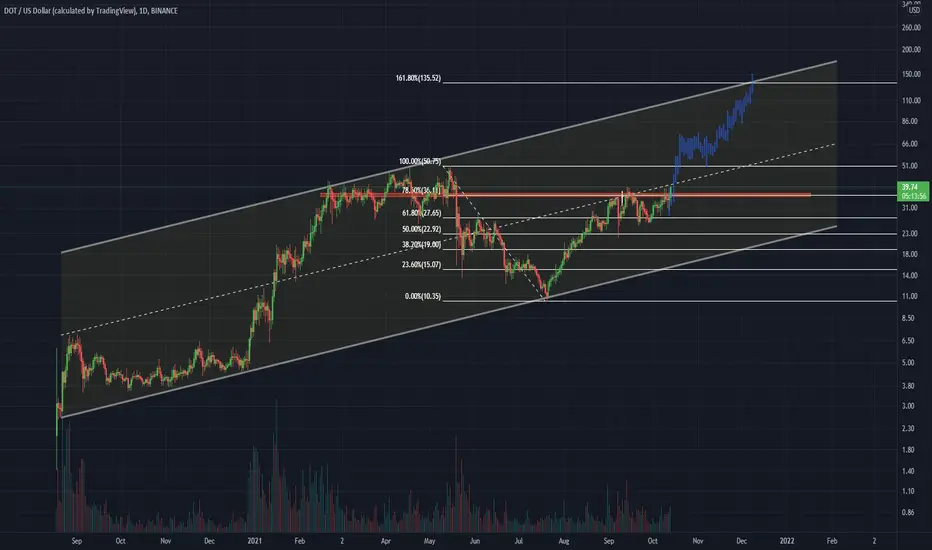
DOT/USD Parallel channelCan DOT get up to the top of the channel again and finish there around the 1.618 ?
Happy trading!
DOT $150 Summer 2022DOT is going to have an amazing Q4 and into 2022
Currently in Wave 3, so far it satisfies an impulse Neo wave, extremely bullish in the near term
SHORT TERM
$50
$75 EOY
LONG TERM
$100
$150 Q2 2022

Polkadot daily chartToday I took a look at the Polkadot chart. And as usual I first looked at daily chart. And what I found? There is a huge resistance at approximately 38-39$. So far, DOT has had a lot of trouble breaking through that resistance. However, when will DOT successfully breake this resistance, I expect explosive growth. Especially in anticipation of the upcoming parachain auctions. I expect at least 100$ DOT.

NEoWave Analysis of polkadot Chart within Daily time frameNEoWave Analysis of Gold Chart within Daily time frame

looooooooooong polkadot prediction, just for funlol i will check in few years, i just imagined a similar path as eth


DOTUSD PRICE PREDICTIONI don't know it will happen or not just playing with charts for fun. Please don't use it as your investment advice.
Not consider any blackswan event:
By the end of January/early Feb 2022: $132
By April retrace: $50
By June/July: $242-$370

Polkadot Holding ResistanceDot so far hold is building up for an explosion!
We are holding our Horizontal & Trend Line Support.
Hoping to see a nice bounce that sets us up for
making Higher Highs and Lower Lows!

1 year PitchFan on DOT Simple PitchFan on DOT
PitchFan/Fork is created by selecting 3 pivot points.
enjoy!

Dota small and lets hope a quick trade I am pretty late here so nothing special about it but I feel I will get DOT 44 faster than stopped out

DOT hitting a new all time highInformation:
This is a blackckain system that allows
both for data and for cryptotokens and t
is build up on the based on the
Nominated Proof of Stake consensus
mode.
What is particularly interesting about this
blockchain is that it builds up a pathway
to transfer information between different blochchains.
Further development in this transfer system (parachains) would lead to
interoperability which is something blockchains does not have in the present day.
Position: Long
Entry price: 35,66
Target price 1: 49,50
Target Price 2: 69,47
Target Price 3: 96,73
% gain: P1: 38% P2: 94% P3: 171%
Indicators:
MACD: The MACD indicator indicates that an upwards trend is starting and that there is bullish movement where the MACD line has passed the signal line and the histogram is opening.
RSI: The RSI line is above 30 at 58,94 but below 70 which indicates that the token is moving forward at a high pace and there might be signs of the token being overbought.
Keltner Channels: The Keltner channels is showing that the trend is going upwards. The price is at the higher channel and indicates on somewhat of a price strength.
Fear and Greed: This indicator would indicate that the market has greedy investors and that the market is due for a correction.
Analysis:
The analysis indicated on bullish signals and a trending market and the general positive outlook with more positive mentions in social media showing that a long period is preferred. On the other hand does the Fear and Greed Index is showing a greedy investor climate, resulting in a consolidation period where there is a larger opportunity to make a significant trade.
An argument to be made for doing this trade is that RSI showing stronger signals and MACD is showing strong bullish signals.
This is not financial advice.


dot has been really good lots of talk about the crowd loan, charts looking to break out break new highs mabe
