DOTUSD: Polkadot Elliott Waves and 2024 PotentialThe Dot is the token of the Polkadot network platform, one of the older generation of crypto currencies. It is touted for Web3 interoperability with cross-blockchain transferability.
It has a fairly robust trading history since 2020 with an 2021 all-time high of about USD 56. In the subsequent bear market, it traded down to about $3.50 in the Fall of 2023. It has experienced a resurgence since to upper single-digit dollar prices.
DOTUSD trade ideas

DOT/USDSupports and Resistances are as shown. Green boxes are the possible buyers zone, red boxes are the possible sellers zone

Polkadot (DOTUSD): The End of an UptrendPolkadot (DOTUSD): BINANCE:DOTUSD
Polkadot appears to have completed Wave (2) with a notable level of certainty. Upon further analysis, it increasingly seems we're witnessing an ending diagonal pattern. This indicates the potential conclusion of the current uptrend shortly, leading to a corrective downturn for Polkadot. While Wave 1 could theoretically extend to $12.82, such a scenario appears less probable. The key factor now is whether we can breach the trendline. Should we remain confined within this diagonal pattern, a prompt downward shift may be expected. For Wave 2, our strategy involves repositioning within the 50% to 78.6% Fibonacci retracement zone. Yet, we must wait to detect any signs of weakness in Polkadot before making our move, as navigating decisions amidst its ongoing bullish momentum presents a considerable challenge.

Alright alright... there you go... hits 23Looks bullish, this should pick up soon and can hit 23. All the best.

Polkadot (DOTUSD): Don't Miss Out ⏰Polkadot #DOTUSD BINANCE:DOTUSD
Polkadot remains a chart of high interest to us, even though we narrowly missed our limit order by 10 cents. Since the near-miss entry and the low at $6, we've seen the development of Waves 1 and 2, and now the question arises whether we're in Wave 3 or experiencing a zigzag correction. However, the latter seems unlikely because we've observed a 3-wave rather than a 5-wave structure moving from Wave (1) to Wave (2) or to Wave C downward, which typically rules out a zigzag scenario.
Should this be the case, we still anticipate our limit order being filled. Surpassing the 78.6% level could indicate we're either in Wave 3 or encountering a possible flat correction. We haven't completely dismissed this scenario yet. If we're indeed in Wave 3, we expect to significantly exceed the $9.6 level or fall well below it, around the 161.8% mark, indicating that Wave (2) has concluded and we're in an upward 5-wave structure.
We'll continue to monitor the situation closely and keep you updated on further developments with Polkadot.

Leap into Success: Why Going Long on DOTUSD is a Winning Move!Just like many other cryptocurrencies, DOTUSD presents fantastic opportunities on the long side! The strength of the bulls shines through with the clear divergence between price and volume during the recent sell-off. The bears literally threw everything but the kitchen sink into the ring to push DOTUSD lower, but they fell far short of even getting close to the lows of late February 2024. Like a coiled spring, the price is primed to shoot upwards any moment now. This is an exciting chance for us to enter the market long with a great risk-reward ratio. Let's seize it!

POLKADOT to $15 than $25 - Inverse Head & shoulders#DOT will have a hype season
(maybe an upgrade or new tech rollout)
The narrative doesn't matter why
Bull market raises all boats.
Nice candle action
2 weeks ago bullish hammer to form the low of the right shoulder
and now a bullish engulfing candle.
Moonbeam , Moonriver and Glint are low caps ways to harness this 4X move

Dot teasing a potential inverse head and shoulder breakoutOne daily candle close above the neckline here and the follow up confirmation candle is in the green for now. As always the initial break above the neckline is often not the true breakout validation move so its plausible we could dip back below the neckline once or thrice before its fully validated, but if it were to validate here the target will be $10.20. *not financial advice*

PolkaDot #DOTUSD: Long-Term AnalysisCryptocurrencies are experiencing challenges post the Bitcoin ETF release, a predicted event that didn't act as a Buy-like catalyst for the market. It serves as a reminder that not all assets surge after such an occurrence. Despite this, the current phase presents an intriguing opportunity, particularly for PolkaDot.
PolkaDot has shown a somewhat delayed response since the low at the end of last year compared to its counterparts. An overarching Wave (1) has formed, and we are currently entering Wave (2). This correction is anticipated to range between 61.8% and 78.6%. A dip below this range would strongly suggest that it might not be Wave (2), and the correction could extend further below the $3.64 mark.
However, if a turnaround occurs within this range, we foresee a minimum upward movement reaching $15.5 🔥


✴️ Polkadot Headed Toward $22, Followed by $36 (ATH $144)Polkadot (DOTUSDT) has entered the bullish zone; says who?
➖ On the left side of the chart we have a market correction or bear-market.
➖ On the middle portion of the chart we have an ending diagonal or consolidation phase.
➖ On the right side of the chart we have a new bullish impulse, a 5-up wave or bullish phase.
A major bullish development is the break as resistance and close above EMA100 on the weekly timeframe.
On the daily timeframe we would say that a close above EMA100 signals medium-term growth potential being confirmed. Weekly this signal is 7X stronger, so we can say that long-term growth potential has been confirmed.
👉 The next target is $22 followed by $36.
There will be much more in 2025 and late 2024. The next All-Time High can reach $144.
(A rough estimate of course. We will go deeper into the numbers as the bull-market develops.)
Remember to boost!
Thanks a lot for your continued support.
Namaste.

$DOT This one has been sleeping for awhile now but bullish sentiments are high right now. Polkadot breaks out on the weekly in a strong way. Trendline is broken and first target $11.20 followed by $13.3. NFI/DYOR

KOG CRYPTO - DOTUSDWelcome all,
We're testing out some Crypto using our unique strategy and applying the algo. We're already running the test on this since last month so far running at 10% gain locked in.
It's a test at the moment, let's see how they perform.
As always, trade safe.
KOG


DOT long term potential targets#DOT #DOT_LTA
potential future target based on previous rise and fall cycle
50$
102$ - 118$ area
147$ - 175$ area
247$ - 309$ area

DOTUSD BINANCE:DOTUSD
DOT formed an upward sloping accumulation structure and entered an uptrend in the price channel after large investors performed the final shakeout (Spring) to shake off small investors at the bottom of the price channel.
This accumulation structure shows that the strength of the Buyers is overwhelming the Sellers.
That gives investors the right to hope for a scenario of a strong Break out of the price channel and into an Uptrend.
When a breakout event occurs, buying is a reasonable choice. However, to be more certain, investors should wait for the confirmation event (BUEC - Back Up To The Edge of Creek) at the upper edge of the price channel.

DOT - Ready for a big runDot gives a live example of the Wyckoff Accumulation Schematics
Rebound target zone: $18 - $21

polkadot bullish setuppolkadot is forming a inverse h/s, as polkadot has been a bit lagging behind i do expect this to break out these next few weeks and retest, i drew a line to what i kind of expect. technical target lines up with the .38 fib level as well, with any pattern we see declining volume as we near the end up the pattern. want to see higher volume then normal when we break the neckline to help confirm break out.

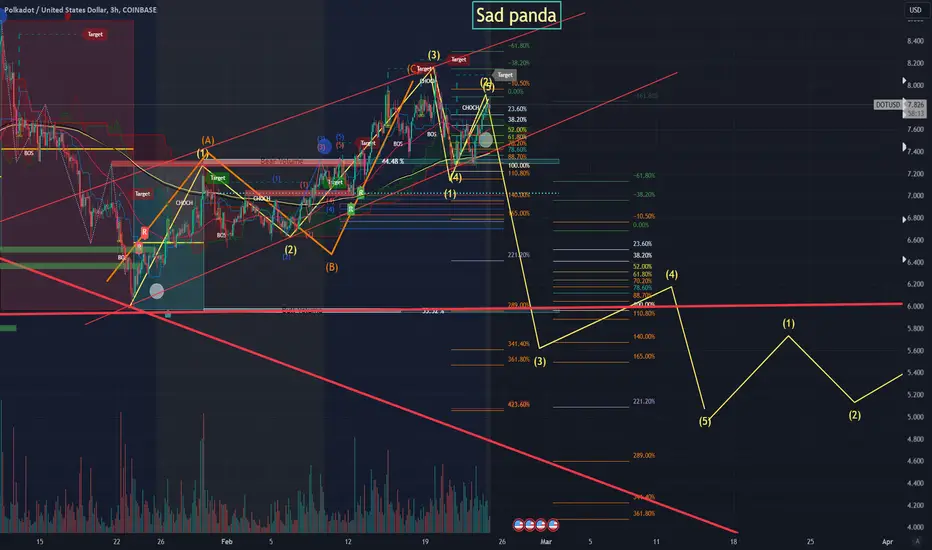
PolkaDot is about to make some sad pandasIf this rolls over you might be lucky to get out at $6.90.
I am looking to buy back in near $4.30
Bull run in a bear market...
NOT FINANCIAL ADVICE!!!!!
DOTUSD BULLISH LONG TO 11.814DOTUSD BULLISH LONG
LONG FROM (NOW): 7.749
consolidation area 1: 7.557 - 7.906
consolidation area 2: 10.843 - 11.838
TAKE PROFIT: 11.814
i will be waiting for this to continue to: 14.088
but for now, SL: 6.512
entry:7.749
take profit: 11.814

Long DOT to 9.60 - 23%+ Profit PotentialAnother trade I've taken today is here on DOT. Once again, my proprietary blend of custom indicators are all flashing green. Reinforcing the bullish signal is, of course, good volume support on the underside of price along with all SMAs (50,100,200). RSI is hot but not in overbought territory as, it would seem, everything else is. I can see us double-topping before any sort of pull-back. I'm in at 7.77 and targeting 9.60. My SL is at 6.86 with a RRR of 2-to-1. Potential gains here top 23% to our final target.

Breatout - Target:13.5$1. Supertrend positiv
2. positiv accumulation
3. positiv squeeze
Targets marked with dotted lines in chart

