DOTUSDT trade ideas
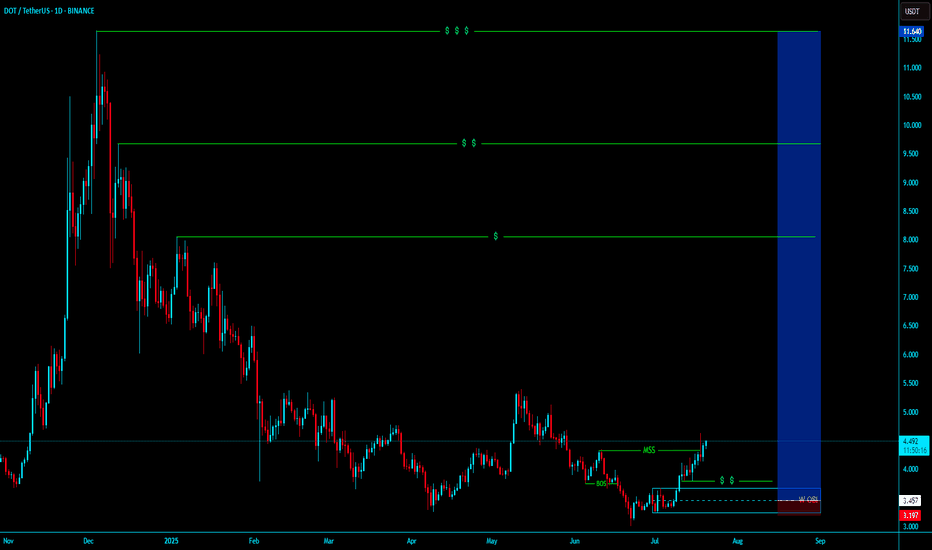
DOTUSD BUY LONG DOTUSD BUY LONG Weekly bisi with EQL Liquidity
BullRun will starts it will going to moon for 4-5 month in daily tf .
Valid Mss with Valid Equal lows Liquidity our buying zone 3.4 $ - 3.5 $ target atleast 50-100 $
holding for 3-5 month from buying , deeply buying from this weekly bisi
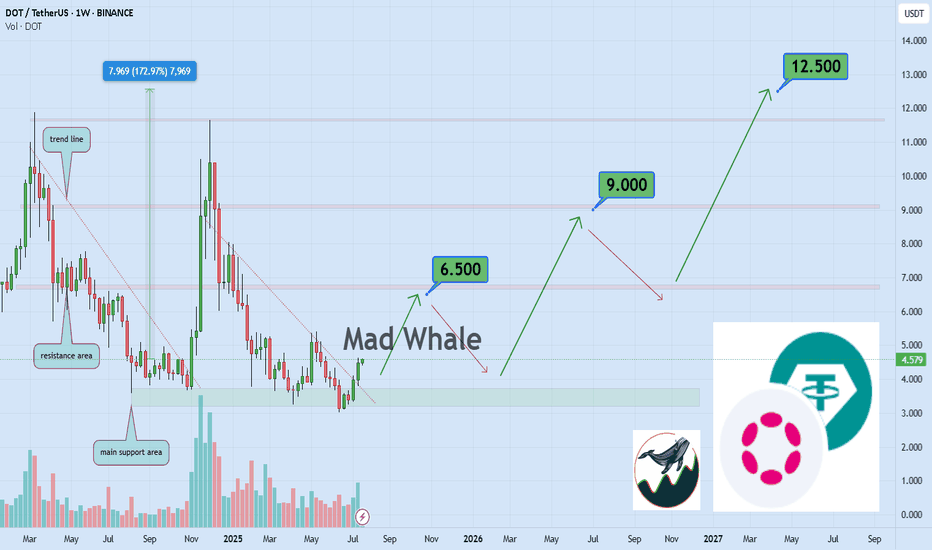
DOT Bullish Outlook: $6.5, $9, and $12.5 AheadHello✌
Let’s analyze Polkadot’s upcoming price potential 📈.
BINANCE:DOTUSDT , I expect a long-term upward trend.
This analysis includes three main targets: $6.5, $9, and a final target of $12.5, which could be reached within 2 to 6 years.
Strong daily resistance and support levels are clearly marked on the chart, showing that the price is following a healthy and reliable path.
✨We put love into every post!
Your support inspires us 💛 Drop a comment we’d love to hear from you! Thanks , Mad Whale🐋
🐋Many of the points and levels shown on the chart are based on personal experience, feeling, and over 7 years of research and daily study of crypto charts.
Some of the lines, channels, and price zones are drawn to make the chart easier to understand and to help imagine possible future price movements.
I’ve also included one very big drop in price even bigger than the others because in the crypto market, it’s common for prices to suddenly fall hard and push out small investors and traders with positions.
The targets on the chart are not guaranteed; they might be reached, or they might not.📚
📜Please make sure to do your own research before investing, and review the disclaimer provided at the end of each post.
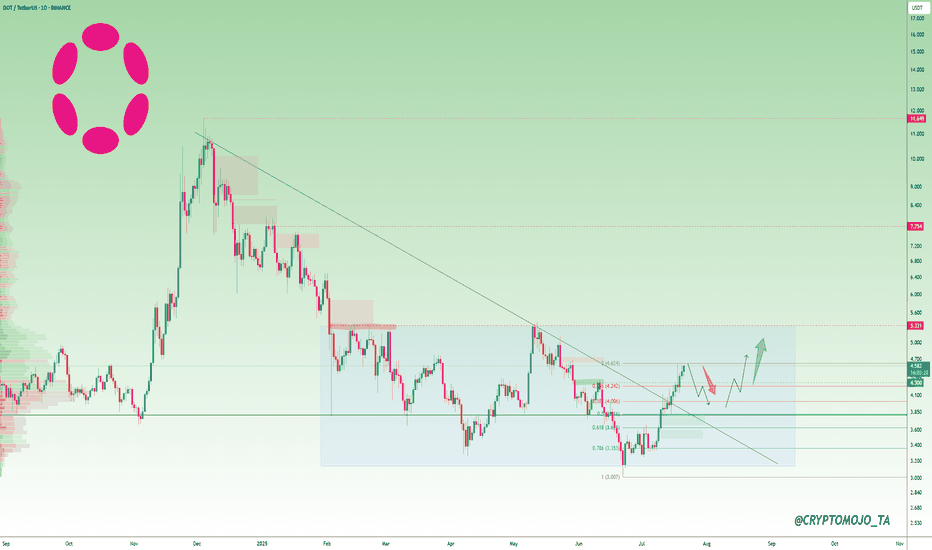
Polkadot Flips $4 — Here’s What Comes Next?DOT is quietly setting the stage... but will it deliver the breakout or fakeout?
After a strong bounce from the $3.35–$3.60 Fib support zone, Polkadot (DOT) has broken out of its downtrend line and flipped the $4.00 level into a support zone. The structure shows a bullish reclaim, but this isn’t a moon signal just yet.
🧠 The chart tells us:
DOT has tapped the key resistance zone around $4.62 (Fib 0.382), where previous sellers were active.
A rejection here could trigger a short-term pullback to the $4.00–$4.20 demand zone.
If buyers defend that level, we could see continuation toward $5.33 next.
A clean break and hold above $4.65 will likely open doors toward $5.60+.
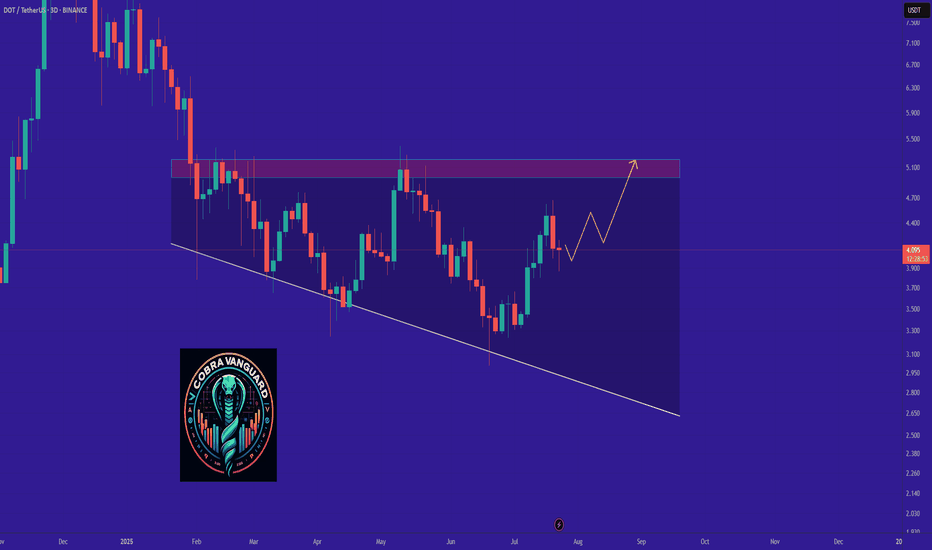
Zoom out: This move is happening as altcoins begin rotating after Bitcoin's recent rangebound action. DOT is still inside a large accumulation range from February. Liquidity builds below $3.35 and above $5.30.
My expectation: Consolidation between $4.00–$4.60 may continue short-term. A deeper retest wouldn’t be surprising, but as long as DOT holds $4.00, the structure favors bullish continuation.
Resistance: $4.62, $5.33
Support: $4.00, $3.60, $3.35
Will DOT surprise the market and break this range?
#DOT #altcoinseason2025
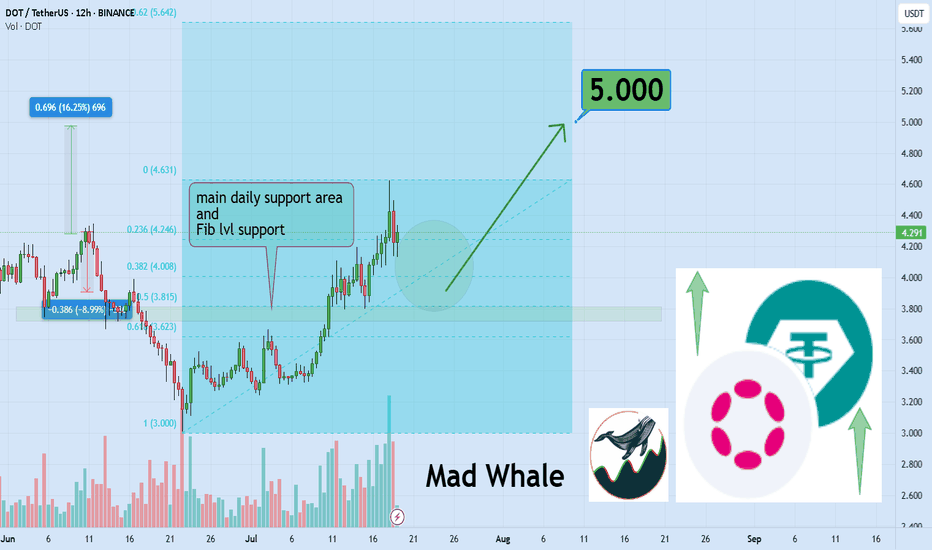
DOT Eyes 15% Rally, Targeting Key $5 Resistance LevelHello✌
Let’s analyze Polkadot’s upcoming price potential 📈.
BINANCE:DOTUSDT has broken above multiple daily resistance levels and is now consolidating near a key support zone. With this bullish structure in place, I'm targeting a minimum 15% move to the upside, with $5 as the main take-profit level. 🚀📈
✨We put love into every post!
Your support inspires us 💛 Drop a comment we’d love to hear from you! Thanks , Mad Whale 🐋
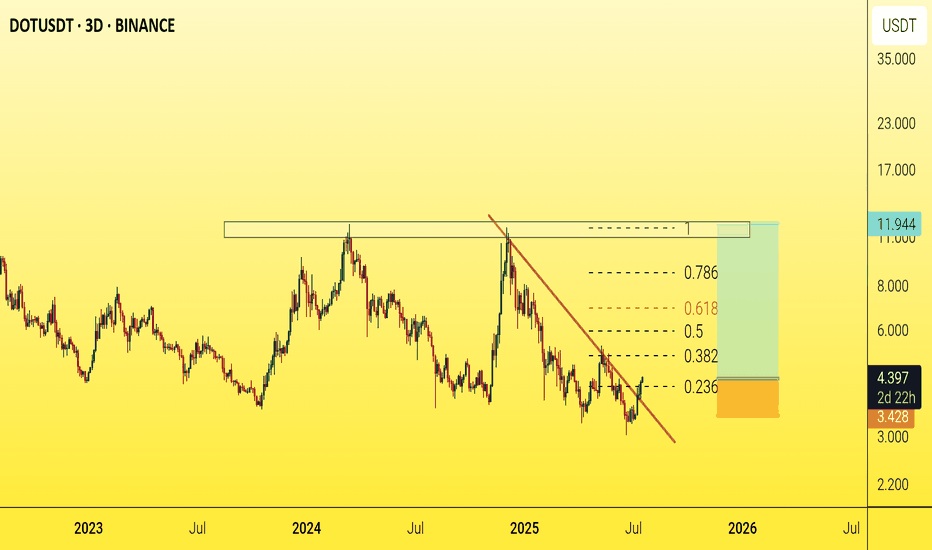
DOTUSDT - A Sleeping Giant in the Bull Market?Polkadot (DOT) has always been one of the leading assets during bull markets
A $10 target now seems inevitable after a clean breakout above the main trendline, followed by a successful retest.🎯
This $10 level has historically acted as a major resistance zone, often manipulated during each bull cycle — price touches it, then sharply pulls back.
But the big question is:
Will DOT break this psychological barrier this time?
Why not?
With many investors losing faith in the crypto market and considering leaving altogether, this might actually be the perfect setup for a massive price explosion.
Historically, the craziest pumps tend to come when confidence is at its lowest.🚀
Best regards Ceciliones 🎯
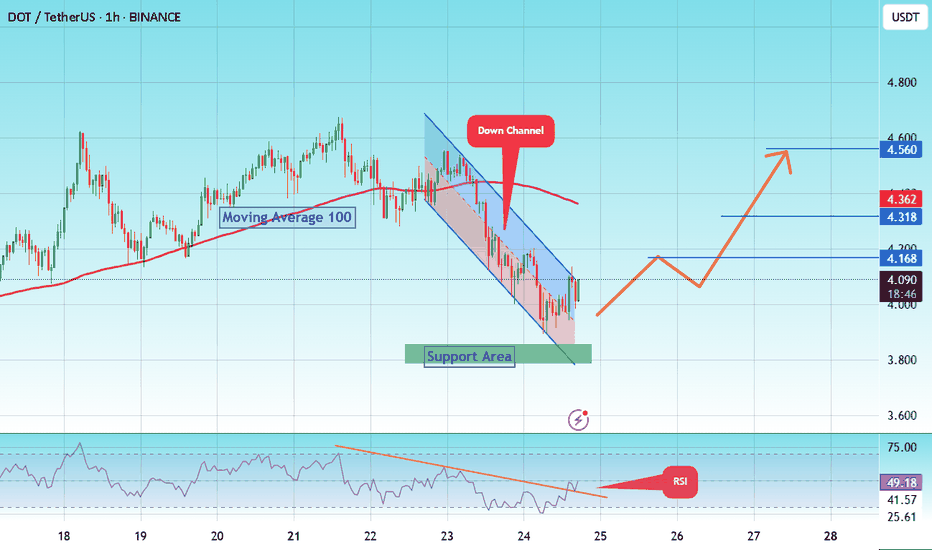
#DOT/Eyes 15% Rally, Targeting Key $ 4.560 Resistance Level#DOT
The price is moving within a descending channel on the 1-hour frame and is expected to break and continue upward.
We have a trend to stabilize above the 100 moving average once again.
We have a downtrend on the RSI indicator that supports the upward break.
We have a support area at the lower limit of the channel at 3,870, acting as strong support from which the price can rebound.
We have a major support area in green that pushed the price higher at 3,800.
Entry price: 4.084
First target: 4.168
Second target: 4.318
Third target: 4.560
To manage risk, don't forget stop loss and capital management.
When you reach the first target, save some profits and then change your stop order to an entry order.
For inquiries, please comment.
Thank you.
Polkadot (DOT) Technical Analysis: Navigating the Path Forward Polkadot (DOT) is currently trading at approximately $4.08 (as of July 25, 2025), having experienced significant volatility in recent months. After reaching a local high of $7.64 in mid-April 2025, DOT has undergone a substantial correction, losing approximately 46% of its value. This analysis examines DOT's technical position and potential trajectory for the remainder of 2025.
Price Structure Analysis
The daily chart reveals DOT has been in a defined downtrend since April 2025, characterized by a series of lower highs and lower lows. Most recently, price has established a trading range between $3.90-$4.30, suggesting potential stabilization after the steep decline. This consolidation zone represents a critical juncture for DOT's next directional move.
Key observations from the price structure:
Descending Channel Formation: DOT has been trading within a descending channel since April, with the upper boundary currently around $4.50 and lower boundary near $3.80.
Support Cluster: Multiple support tests in the $3.90-$4.00 region have held thus far, potentially forming a base for a recovery attempt.
Volume Profile: Trading volume has been notably higher during recent consolidation compared to previous months, suggesting increased interest at these price levels.
RSI Analysis: Signs of Potential Reversal
The Relative Strength Index (RSI) provides compelling evidence for a potential trend shift:
Bullish Divergence: While price made lower lows in late June and early July, the RSI formed higher lows, creating a bullish divergence pattern that often precedes reversals.
Oversold Recovery: The RSI reached oversold territory (below 30) in mid-June and has since recovered to the 40-45 range, indicating diminishing selling pressure.
RSI-based MA Crossover: The RSI has recently crossed above its moving average, a signal that has historically preceded price recoveries for DOT.
The 4-hour chart shows the RSI establishing a series of higher lows while price consolidates, suggesting building momentum beneath the surface despite sideways price action.
Support/Resistance Level Analysis
Critical price levels that will influence DOT's next directional move:
Support Zones:
Primary: $3.90-$4.00 (current consolidation floor)
Secondary: $3.60-$3.70 (previous support from May)
Tertiary: $3.30-$3.40 (major support from early 2025)
Resistance Zones:
Immediate: $4.30-$4.50 (upper boundary of current consolidation)
Major: $4.80-$5.00 (previous support turned resistance)
Structural: $5.70-$6.00 (descending trendline from April high)
Volume Analysis
Volume patterns provide additional context for DOT's current position:
Declining Sell Volume: Selling volume has progressively decreased during the recent consolidation phase, suggesting exhaustion of selling pressure.
Volume Spikes on Bounces: Recent upward price movements have been accompanied by above-average volume, indicating potential accumulation.
Volume Contraction: The overall contraction in trading volume during the recent range-bound price action typically precedes significant moves.
Market Structure Analysis
Examining DOT's market structure reveals several important patterns:
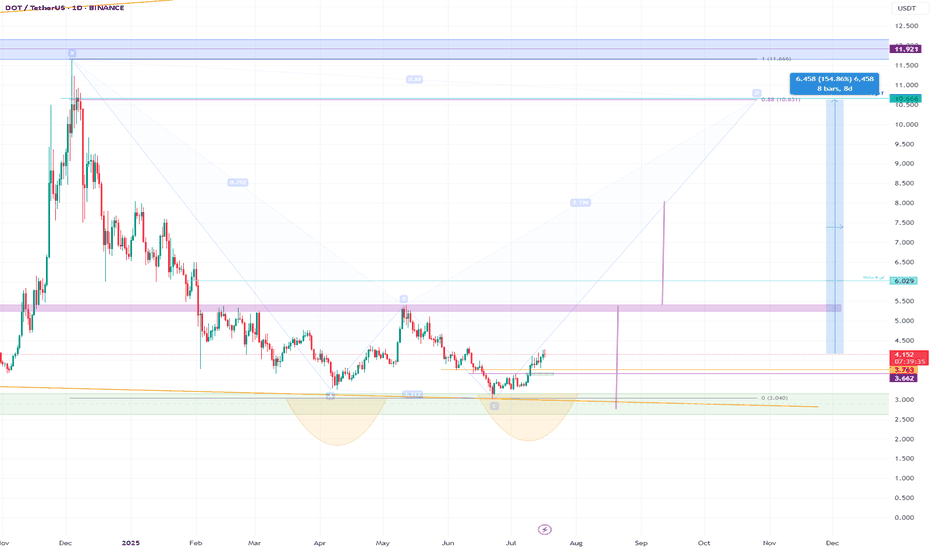
Potential Inverse Head & Shoulders: The recent price action is forming what could develop into an inverse head and shoulders pattern, with the neckline around $4.50. Completion of this pattern would project a move toward $5.20-$5.40.
Wyckoff Accumulation: The price action since mid-June displays characteristics consistent with Wyckoff accumulation, including:
Spring phase (drop to $3.59 in late June)
Test phase (retest of lows in early July)
Sign of strength (move toward $4.20 on increased volume)
Compression Pattern: Price volatility has been decreasing, forming a compression pattern that typically resolves in a strong directional move.
Moving Average Analysis
Moving averages confirm DOT's bearish positioning but show early signs of potential trend change:
Below Key MAs: DOT remains below all major moving averages (50, 100, and 200-day), confirming the bearish trend.
MA Compression: The gap between shorter and longer-term moving averages is narrowing, often a precursor to trend shifts.
RSI-based MA Crossover: While price MAs remain bearish, the RSI-based moving average has turned upward, often an early indicator of trend reversal.
Fibonacci Retracement Analysis
Using the move from the April high ($7.64) to the June low ($3.59):
23.6% Retracement: $4.54 (immediate target on breakout)
38.2% Retracement: $5.13 (medium-term target)
50% Retracement: $5.62 (significant resistance level)
61.8% Retracement: $6.10 (major resistance level)
The current price action suggests DOT is attempting to establish a base before potentially targeting these retracement levels.
Scenario Analysis
Bullish Scenario
If DOT can decisively break above the $4.50 resistance level with increased volume:
Initial Target: $4.80-$5.00 (previous support turned resistance)
Secondary Target: $5.50-$5.70 (50% retracement level)
Extended Target: $6.00-$6.30 (61.8% retracement and structural resistance)
Catalysts: Successful parachain upgrades, increased developer activity, or broader crypto market recovery could drive this scenario.
Bearish Scenario
If DOT breaks below the $3.90 support level:
Initial Target: $3.60-$3.70 (previous support)
Secondary Target: $3.30-$3.40 (major support level)
Extended Target: $3.00 (psychological support)
Catalysts: Continued weakness in the broader crypto market, technical issues with the Polkadot network, or regulatory concerns could trigger this scenario.
Most Probable Scenario
Based on the weight of technical evidence, the most probable scenario appears to be:
Continued consolidation between $3.90-$4.50 for the next 1-2 weeks
Eventual breakout above $4.50 targeting the $5.00 level
Establishment of a new trading range between $4.50-$5.50 through August-September
This scenario is supported by the bullish divergences, decreasing selling volume, and early signs of accumulation.
Trading Strategy Recommendations
For Long-Term Investors
Accumulation Strategy: Consider dollar-cost averaging in the current $3.90-$4.20 range
Position Sizing: Maintain appropriate position sizing given DOT's high volatility
Key Levels: Use the $3.60 level as a stop-loss for new positions
For Active Traders
Range-Bound Strategy: Trade the current range between $3.90-$4.30 until a breakout occurs
Breakout Strategy: Enter on confirmation of breakout above $4.50 with targets at $4.80, $5.20, and $5.70
Risk Management: Maintain tight stops below $4.30 on breakout trades to protect against false breakouts
For Risk-Averse Investors
Confirmation Approach: Wait for confirmation of trend reversal (price above $4.80 and 50-day MA)
Partial Position: Consider establishing partial positions at current levels with defined risk parameters
Technical Triggers: Look for RSI moves above 60 as confirmation of momentum shift
Conclusion: Cautious Optimism for DOT
The technical picture for Polkadot suggests we may be approaching an inflection point after the substantial correction from April highs. Multiple technical indicators point to diminishing selling pressure and early signs of accumulation, creating the conditions for a potential recovery.
While DOT remains in a technical downtrend, the convergence of bullish divergences, volume patterns, and market structure suggests the potential for a trend reversal in the coming weeks. The $4.50 level represents the key technical hurdle that must be overcome to confirm this shift.
For investors and traders, a balanced approach is warranted—acknowledging the current bearish trend while positioning for a potential reversal. The risk-reward profile appears increasingly favorable for cautious accumulation at current levels, with clearly defined risk parameters.
The most probable path forward appears to be continued consolidation followed by a gradual recovery toward the $5.00-$5.50 range by late Q3 2025, contingent upon broader market conditions and continued development progress within the Polkadot ecosystem.
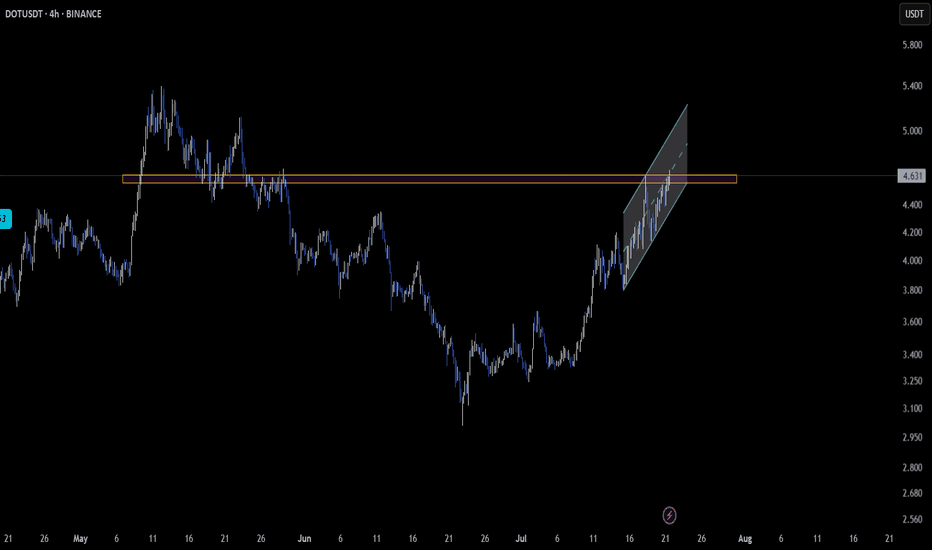
DOT – Structure Aligning Across Multiple TimeframesCRYPTOCAP:DOT is quietly setting up an interesting technical structure across different timeframes 📊.
On the 2-hour chart, price is gliding inside an ascending parallel channel, respecting both the upper and lower trendlines 📈. This clean structure often leads to smooth momentum-driven moves.
Zooming out to the daily timeframe, CRYPTOCAP:DOT is reclaiming a key support-resistance zone 🟢. This could indicate that bullish momentum is quietly building beneath the surface.
Traders should stay attentive—when multiple timeframes align, the probability of a decisive move increases 🚀.
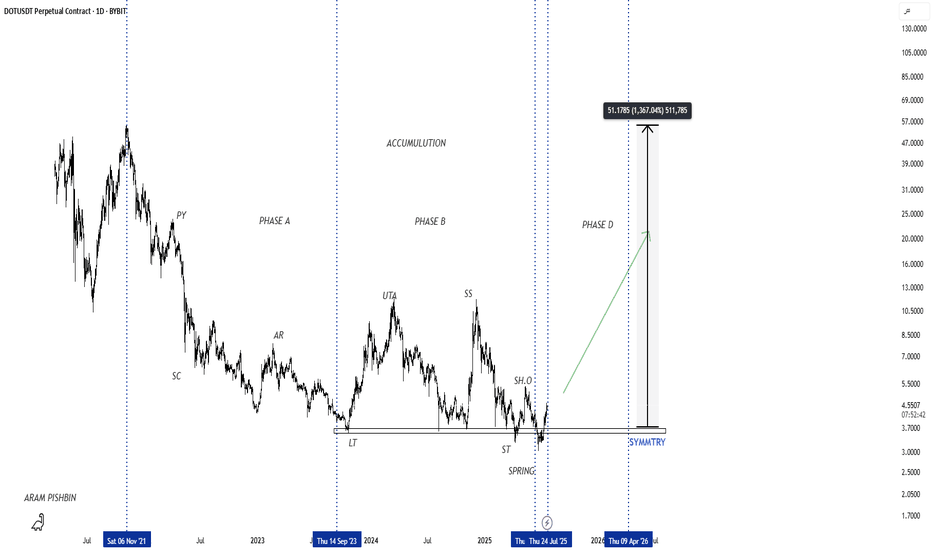
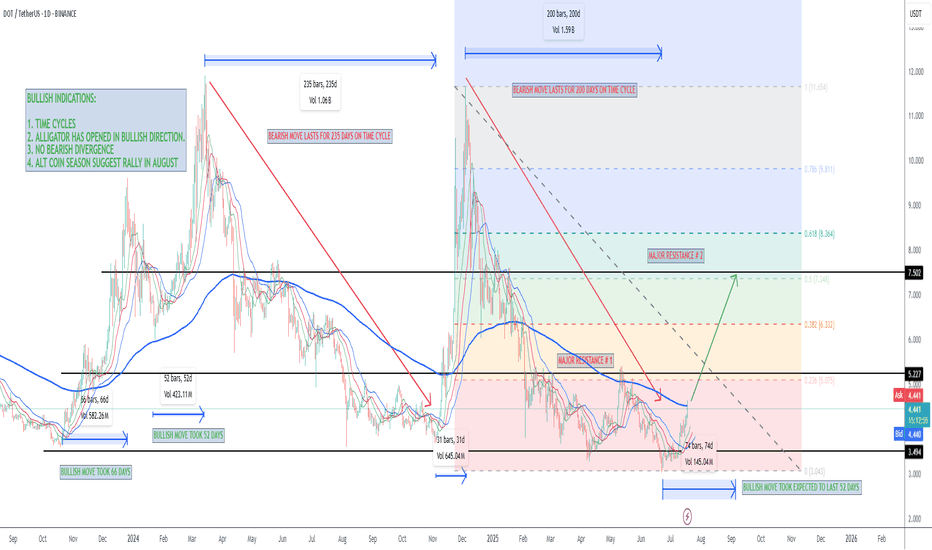
DOT Reloading for Takeoff ?CRYPTOCAP:DOT has been following a textbook Wyckoff cycle — moving from markdown into accumulation, followed by a sharp markup, then another markdown, and once again settling into a fresh accumulation zone.
After retesting the major support at $4 and holding above it, DOT is showing early signs of bullish momentum. If this structure continues, we could be preparing for another markup phase with potential targets at the $6, $10, and even $11 resistance zones.
This setup mirrors the previous cycle — will history repeat itself?
📍 Key Levels:
Support: $4.00 & $3.00
Resistance: $6.00, $10.00, and $11.00
Let me know your thoughts in the comments 👇
📚 Always follow your trading plan regarding entry, risk management, and trade management.
Good luck!
All Strategies Are Good; If Managed Properly!
~Richard Nasr
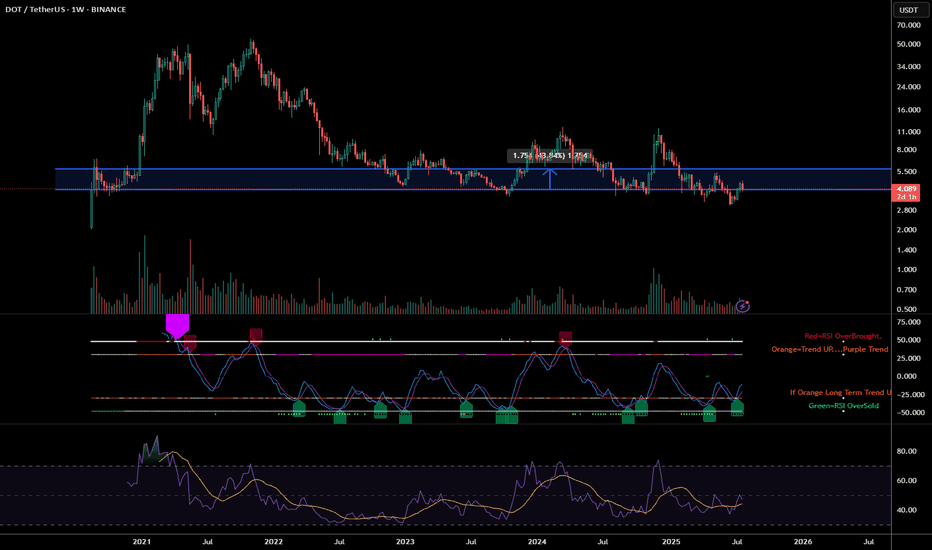
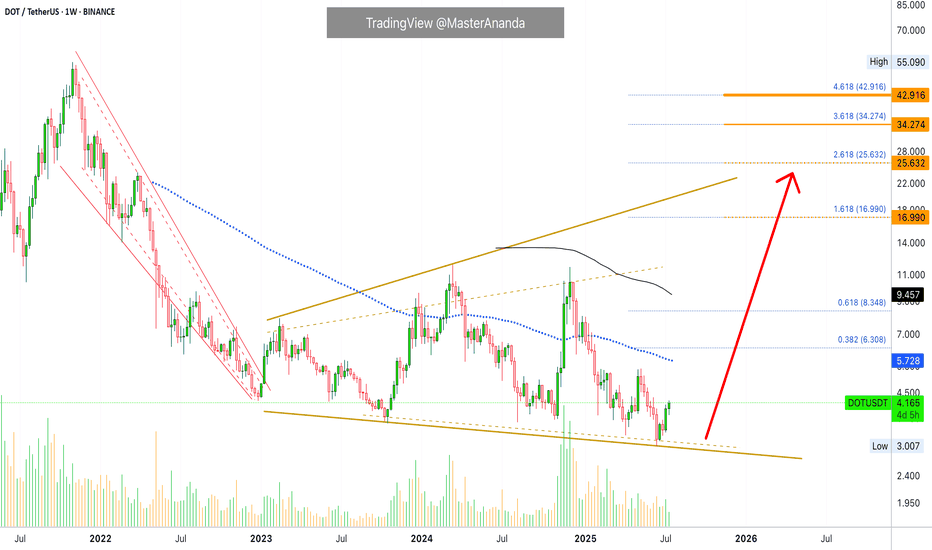
Polkadot Opportunity Buy Zone · Near Bottom · 2025 Bull MarketThis is what I mean: Opportunities are endless in this market. Compare Polkadot to say, Solana or Cardano which I shared just recently. Can you notice the huge difference?
First, Polkadot is still trading below EMA89 and MA200 weekly. Not to be taken as a bearish signal but instead to be interpreted as the pair being very early in its bullish cycle.
While Solana is trading ultra-high, super-strong, one of the strongest pair, which is bad if you want to go LONG (high risk with a small potential for reward), Polkadot is trading within the opportunity buy zone, very close to its bottom (low risk vs a high potential for reward).
I am a buyer. I am a Cryptocurrency fan. I am a bull.
So I want low prices and that is why low prices are good.
This is an opportunity, DOTUSDT. It is trading low now but it won't be trading this low for long, not even weeks. It is likely to start advancing within days. Once the bottom is gone it is gone forever. These altcoin projects will be the new tech giants and they will rise long-term. This is your chance. This is your opportunity for long-term trading success. Once you catch the bottom, you can't go wrong.
The chart is showing a long-term broadening channel. This is part of the transition period, from bearish to bullish, the consolidation phase. While the channel looks pretty big, the swings, if you activate the linear chart you can see the truth. Perspective. You will see a true bottom on the chart. From the bottom we grow.
When the action challenges the lower boundary of the channel, support; the market reverses, in this case Polkadot will start to go up. It is already growing. Several weeks rising. The upper boundary is the minimum giving us more than 425%. But we are not aiming for the minimum, we want high in the least, we want the maximum, so let's go for a new all-time high or just below the last one.
Namaste.
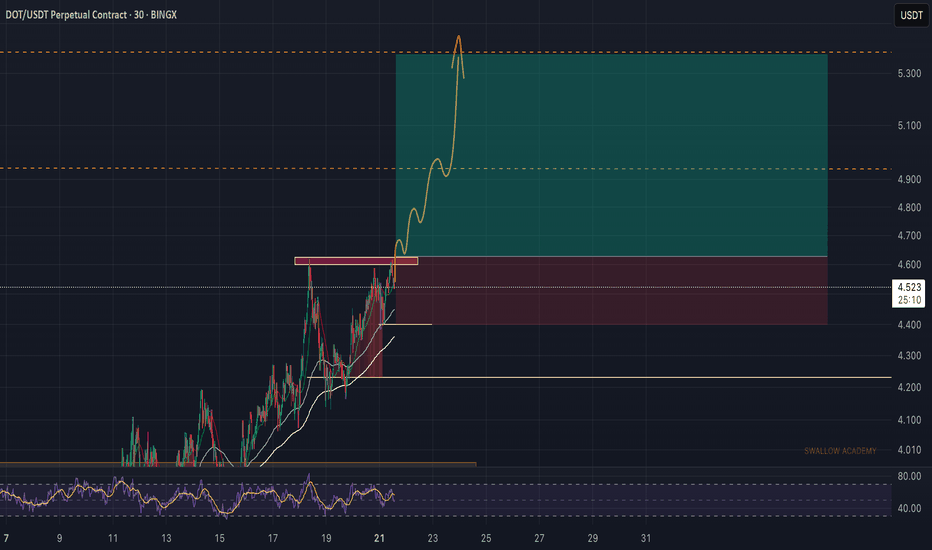
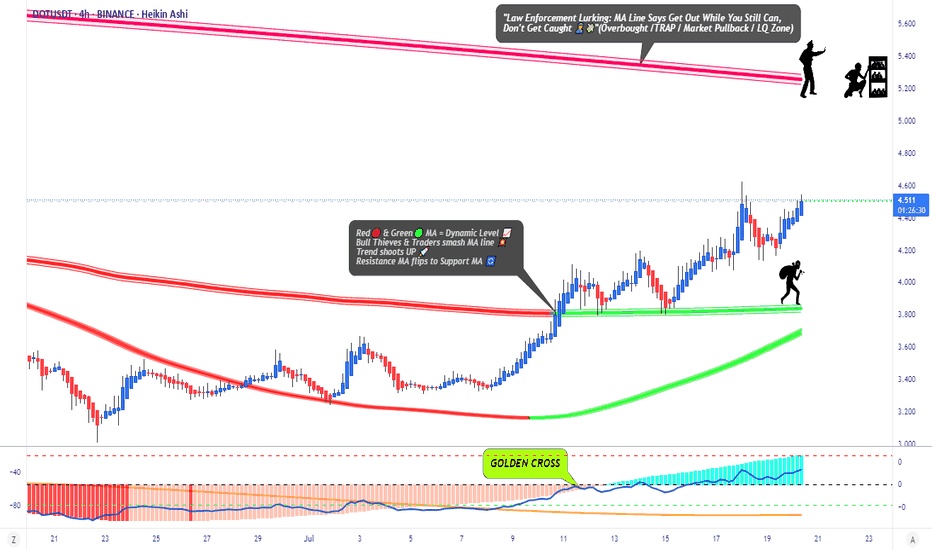
DOT/USDT Profit Heist | Don’t Let Bears Catch You🚨Polkadot Crypto Vault Break-In Plan | DOT/USDT Robbery Blueprint🚨
🌍 Hola Heist Crew! 💰📡
Ready for another vault-cracking strategy? Here's your DOT/USDT Crypto Heist Plan based on pure Thief Trading Style™—a fusion of smart-money tactics, technical traps, and stealth execution. 🎯💸
🔓 🎯 Entry Zone – Lockpick Ready
"The vault’s wide open! Swipe the bullish loot anywhere, anytime—but smart thieves plan pullback entries."
📌 Recommended: Use 15–30 min timeframe for sniper buys near swing highs/lows.
💡 Pro Move: DCA with layered buy limits like a seasoned thief stacking getaway routes. 🧠💵
🚔 Stop Loss – Evade the Patrol
📍 Secure SL just below the nearest 4H candle wick low (e.g., 4.000 zone)
🔐 Customize SL to match your risk profile & lot size—escape routes vary by thief rank.
💣 Target – Break the Vault & Vanish
🎯 TP: 5.200
🕶️ Optional: Dip out early if market heat rises near resistance traps. Escape clean.
⚠️ High Alert – Police Checkpoint Ahead
👮 Red MA Zone = Barricade.
It’s a hotspot for bearish cops + consolidation traps.
Only strong thieves survive here—book profits before you get cornered.
💼 For Scalpers & Swing Agents
🔍 Scalpers: Only ride long—quick bags, quick exit.
💰 Swingers: Follow the full robbery plan. Patience pays.
🎯 Trailing SL is your body armor—keep it tight.
📊 Fundamental Force Behind the Break-In
🔥 DOT/USDT is flashing bullish momentum supported by:
Sentiment shift
Intermarket alignment
COT positioning
On-chain data
📡 Stay updated via macro reports & sentiment dashboards—intel is profit.
📰 News Alert – Chaos Creates Opportunity
🧨 Avoid fresh entries during high-volatility news drops.
🎯 Trailing SL can save you during headline crossfire.
❗️Disclaimer:
This blueprint is for educational purposes only. Always conduct your own recon and apply strict risk management. Thieves who don’t scout first... get caught.
🚀 Boost the Heist – Support the Crew
💥 Smash that “Boost” if this plan adds value 💥
Your boost fuels more chart crimes, more profit hits, and a growing rob-the-market brotherhood! 💪💼📈
🧨 See you in the next job... Stay hidden, stay funded!
– Thief Trading Style™ HQ 🕶️🐱👤💰🚁
DOTUSDT – Spot 2025 Long-term Buy RecommendationDOTUSDT – Spot 2025 Long-term Buy Recommendation
Context: After a long period of accumulation, DOTUSDT previously attempted to break above $7, but that move was just a false bottom formation—a scenario we accurately anticipated with our advanced monitoring system.
Current Outlook: The Weekly (W) timeframe has now completed its bottom formation. It's time to continue accumulating DOT spot positions for the long term.
Trade Type: Long-term Spot Hold
Entry: Around $4 – price is already low, no need to bargain further.
Exit Strategy: Take profit based on peaks in the Weekly (W) or Monthly (M) timeframes—lock in gains progressively as new highs are formed.
Action: Start or continue accumulating DOTUSDT spot positions now.
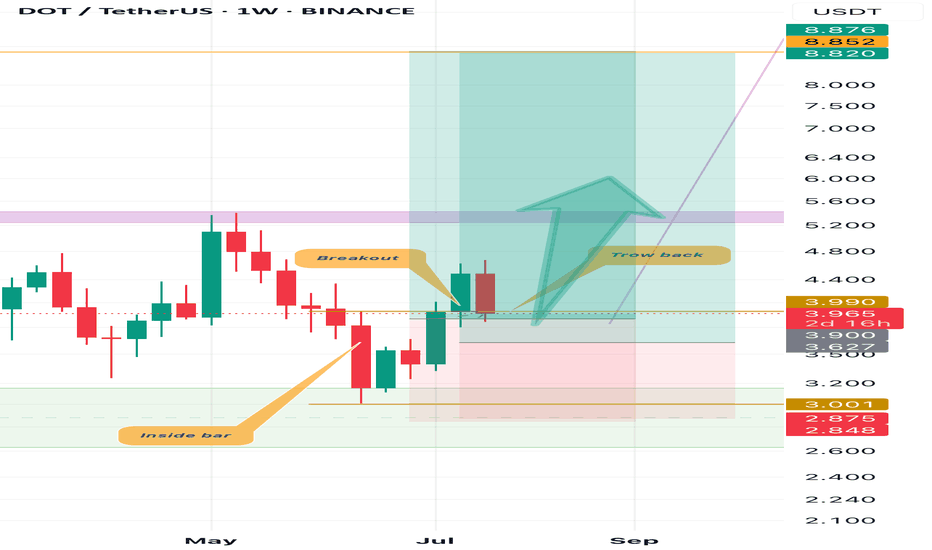
DOT/USDT Breakout Watch – Eyes on the $3.98 ResistancePolkadot (DOT) is forming a solid base and is now approaching a key resistance zone around $3.98. A clean breakout above this level could mark the start of a bullish reversal.
🔍 Technical Setup:
DOT is consolidating near resistance after a prolonged downtrend.
Breakout above $3.98 signals strength, possibly confirming a trend shift.
Volume spike and higher lows suggest accumulation.
🎯 Bullish Targets Post-Breakout:
TP1: $5.00 (psychological + structural level)
TP2: $10.00 (mid-range consolidation zone)
TP3: $15.00 (macro resistance, potential long-term play)
🛡️ Support to watch on pullbacks: $3.50–$3.60 zone.
Bias: Bullish above $3.98
Invalidation: Close below $3.50 with volume
Keep an eye on the breakout confirmation with volume and candle structure. DOT might be gearing up for a larger move if the market sentiment aligns.
