Dot futures postionsFirst the dot go to leq price and touch the sl of long postions trader after go to the price that show them
DOTUSDT trade ideas

#DOT/USDT Ready to go higher#DOT
The price is moving in a descending channel on the 1-hour frame and sticking to it well
We have a bounce from the lower limit of the descending channel, this support is at 6.60
We have a downtrend on the RSI indicator that is about to be broken, which supports the rise
We have a trend to stabilize above the moving average 100
Entry price 7.00
First target 7.30
Second target 7.83
Third target 8.43

DOT/USDTI think wave 3 of 2 is complete. I'm buying with this setup. Only 1% risk. Don't forget capital management.
Polkadot Dot usdt Daily analysis
Time frame 4hours
Risk rewards ratio >2 👈👌
Technical analysis base on Eliot waves
The correction 3points (ABC) Eliot waves has finished ✅️
Now, I think, impulse Eliot waves starts . (1-5)
I designed the fist impulse wave on the first branche of main Eliot waves. ✅️
If this analysis happens, we will have a unbelievable alt-season. 🎅💥💥🎅
What's your analysis? 🤔
Do you think impulse wave is started?🤔

Fill Your Bag with DOT !! has just flashed a historical MACD buy signal! Recently, we saw a healthy correction in the market, so there's no need to worry.
If you're considering adding Polkadot to your portfolio, now could be the right time to do so.
Take a look at my previous analysis—it was perfectly timed! Based on the current trends, I believe we could see a minimum price of 40 USD within the next 2-3 months.
As I always say, while you can’t predict the exact timing of the market, this opportunity is worth considering. (Disclaimer: This is not financial advice.)

dot after retrecment!buy area (5.2-3.8)
tp1 (11.648)-(123%)
tp2 (13.59)-(160%)
tp3 (17)-(227%)
lets goOo.

SPOT DOT LONG 21.12.2024Fixation after abnormal activity.
🎯Purpose:
19.232
‼️Risk per trade: 0.5% of the allocated funds for spot trading.
Thank you for subscribing and responding🚀.

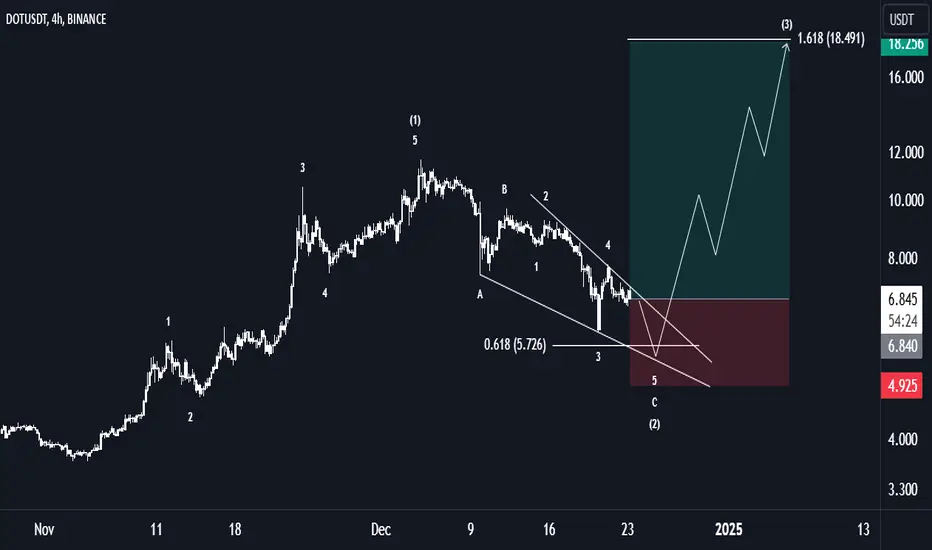
Polkadot Elliot Wave - Daily and WeeklyThe analysis shows a completed 5-wave impulse, followed by an ongoing A-B-C correction. Key support at 7.500: a bounce here could trigger Wave 3, with ideal targets between 17.300 and 23.150 based on Fibonacci levels. Watch for volume and breakout confirmation!

DOTUSDT | FIRST LINE OF DEFENSEDOTUSDT: Potential Support at the Green Box
In this analysis, the green box emerges as a promising support area worth keeping on our radar.
This zone holds significance for two reasons:
It represents a key demand area, where buying interest could outweigh selling pressure.
It serves as the first line of defense, a crucial level that could prevent further downside.
Trading Strategy
Lower Time Frame Reactions: The focus is on monitoring price action within the green box and the adjacent blue box zone.
Long Trade Opportunities: If the price shows favorable reactions (e.g., bullish patterns or increased volume) in these areas, it can set the stage for well-structured long trades.
This approach emphasizes precision and patience, allowing for entries that align with market dynamics.
Summary
The green box in DOTUSDT is a zone to watch closely as a potential pivot for the next upward move. Stay alert to lower time frame signals to fine-tune trade setups and capitalize on this opportunity.
I keep my charts clean and simple because I believe clarity leads to better decisions.
My approach is built on years of experience and a solid track record. I don’t claim to know it all, but I’m confident in my ability to spot high-probability setups.
My Previous Analysis
🐶 DOGEUSDT.P: Next Move
🎨 RENDERUSDT.P: Opportunity of the Month
💎 ETHUSDT.P: Where to Retrace
🟢 BNBUSDT.P: Potential Surge
📊 BTC Dominance: Reaction Zone
🌊 WAVESUSDT.P: Demand Zone Potential
🟣 UNIUSDT.P: Long-Term Trade
🔵 XRPUSDT.P: Entry Zones
🔗 LINKUSDT.P: Follow The River
📈 BTCUSDT.P: Two Key Demand Zones
🟩 POLUSDT: Bullish Momentum
🌟 PENDLEUSDT.P: Where Opportunity Meets Precision
🔥 BTCUSDT.P: Liquidation of Highly Leveraged Longs
🌊 SOLUSDT.P: SOL's Dip - Your Opportunity
🐸 1000PEPEUSDT.P: Prime Bounce Zone Unlocked
🚀 ETHUSDT.P: Set to Explode - Don't Miss This Game Changer
🤖 IQUSDT: Smart Plan
⚡️ PONDUSDT: A Trade Not Taken Is Better Than a Losing One
💼 STMXUSDT: 2 Buying Areas
🐢 TURBOUSDT: Buy Zones and Buyer Presence
🌍 ICPUSDT.P: Massive Upside Potential | Check the Trade Update For Seeing Results
🟠 IDEXUSDT: Spot Buy Area | %26 Profit if You Trade with MSB
📌 USUALUSDT: Buyers Are Active + %70 Profit in Total

DOT Sing Long Entry 6.8 12/20/2024DOT Swing Long Idea 12/20/2024. Waiting for confirmation of lows to enter trade.

Big currencyhello friends
This currency is in a good position with the correction it has had and now you can enter one step and we have specified two lower limits for you in case of further correction of the market and we expect very high goals from this currency.
Be successful and profitable.

DOT current trendlines, patterns and possible scenario (4h)BINANCE:DOTUSDT was forming an ascending channel in which it bounces up and down, frankly speaking the volume VAH indicates it could, IF it goes up further, bounce from it and touch the trendline once more before aiming higher. but first it needs to break the 50% fib level it got rejected from short term.
the touch of the lower trendline would coincide with the current point of control (dotted line) perfectly.
take this as a fast setup, will adjust it further if it gives any further indications.

DOT: I bet on it right nowCurrent state: Testing strong support area.
I sold part of my DOTs at 9.4 and repurchase again on 6.4
My current plan:
1) The amount that I re-purchased right now at 6.4 will be sold again at 9.4
2) I have other DOTs to be sold on 12, 15, 18, 21, 27
3) I have other DOTs to be sold much higher (if things go crazy)
3) I also have buy orders at 4.2
4) I also have fiat to buy lower than 4.2
This is just my plan. The idea is to cover all possible scenarios. Being happy on the way up (I sell higher) and happy on the way down (I buy lower)
Please, do your own plan, do not follow my plan. Each one has different amount of money.

$DOT LONG at Order BlockDOT Long around $6.1-$6.5 at OB which seems like a valid OB as other elements of Smart Money exist as FVG, BOS and Liquidity

Polkadot DOT’s $8.442 Standoff: Bounce or Breakdown?DOT is hovering around a key support zone, at $8.442.
1. A quick dip and bounce back from $8.442 might hint that the bulls aren’t ready to give up just yet (Dashed Green Projection).
2. If DOT confidently pushes through $9.659, the bulls might have a party, with the next pit stop likely around $11.009. A clean move here could set the stage for some exciting action to the upside (Solid Green Projection).
3. However, if the $8.442 level crumbles, things could get dicey fast. Bears might take over, dragging the price toward $7.000, a critical support level where DOT could try to catch its breath (Red Projection).
Right now, DOT is at a tipping point—will it rise to the occasion or falter? Keep your focus on $9.659 and $8.442; they’re calling the shots for what comes next.

DotUsdt shortDot created a Head and shoulders pattern and broken the neckline,so in my opinoin target for sell the dot till next line support .

POLKADOT- BUY HIGH, SELL HIGHERIn the midst of chaos, I've decided to increase my position in Polkadot, as I've been holding since $5.82. The structure continues to show bullish signals, and we’re still in a bull market. Moreover, the Christmas and New Year rally hasn’t even started yet.
For traders feeling anxious right now, it's better to step away from the screen and avoid making impulsive decisions. For those focused on knowledge and strategy, there’s no better moment to consider opening a long position—fully aware of the possibility that your stop-loss might be hit.
Trade Management:
Entry: $7 or market price
Stop-loss: $6.31 (keeping the previous position intact)
Remember to control your emotions and avoid overtrading. Maintaining liquidity is crucial—don’t put all your capital at risk. Protect your psychology and trust your skills. Don’t let the market shake your confidence in what you know works.
I’m sticking to my plan, as mentioned in my previous idea. Nothing changes if you follow your plan.
May God bless you all.
Jay

DOTUSDT still bearishall the scenarios on DOT for now are bearish, unless something sudden happen (some news)
these my expectations as scenarios for the coin
in my opionion getting back to the bottom is not impossible


Alikze »» DOT| Bullish Wave 3 or C Scenario🔍 Technical analysis: Bullish Wave 3 or C Scenario - 1D
📣 BINANCE:DOTUSDT encountered demand on the weekly time frame after a zigzag correction to the $3.70 range, which succeeded in breaking the supply zone.
🟢 In the analyses presented on the 4-hour and 8-hour time frames, Polkadot managed to break out of the congestion after successfully breaking it, which broke the supply zone due to buyer pressure.
🟢 Currently, given the momentum, Polkadot can continue its upward trend to the next supply zone after a pullback to the green box area.
💎In addition, this motivational wave can also touch its historical major ceiling if the second supply zone is broken.
»»»«««»»»«««»»»«««
Please support this idea 💡 with a LIKE 👍 and COMMENT 💬 if you find it useful and Click "Follow" on our profile if you'd like these trade ideas delivered straight to your email 📧 in the future.
Thanks for your continued support.🙏
Best Regards,❤️
Alikze.
»»»«««»»»«««»»»«««

DOTUSDT | Personally Loading Here | Mid Term (1D)DOTUSDT | Personally Loading Here | Mid Term (1D)
As part of my profit taking strategy, I like to go through and map out potential levels of interest based on semi-bullish to very bullish mock up price action using fractals and fibs.
Based on concept of money flow... BTC, then ETH, then Large Caps, Then Mids and Smalls, I am personally heavier skewed loaded up on mid to small cap coins with bullish chart setups and high profit potentials.
I think its getting close for DOT to make another move... This looks like a good area to load up for me personally. First stop, 13.45 to test, small pullback, consolidate, wind up, and up up up to 17.68 then 26.03 then beyond.
Additional altcoin near term and midterm chart ideas listed below.
ALGOUSDT | Personally Loading Here | Mid Term (1D)
XUSDT | Personally Loading Here | Mid Term (1D)
DEGENUSDT | Personally Loading Here | Mid Term (1D)
DARUSDT | Personally Loading Here | Mid Term (1D)
VRAUSDT | Personally Loading Here | Mid Term (1D)
DRIFTUSDT | Mapping Out Possibilities | Near Term (4HR)
XUSDT | Mapping Out Possibilities | Near Term (4HR)
OLUSDT | Mapping Out Possibilities | Near Term (4HR)
GRASSUSDT | Mapping Out Possibilities | Near Term (12HR)
ALGOUSDT | Mapping Out Possibilities | Near Term (12HR)
GRASSUSDT | Mapping Out Possibilities | Mid Term (1D)
XUSDTUSDT | Mapping Out Possibilities | Mid Term (1D)
MYRIAUSDT | Mapping Out Possibilities | Mid Term (1D)
GHSTUSDT | Mapping Out Possibilities | Mid Term (1D)
DOGSUSDT | Mapping Out Possibilities | Near Term (4HR)
DEGENUSDT | Mapping Out Possibilities | Mid Term (1D)
MANEKIUSDT | Mapping Out Possibilities | Mid Term (1D)
CSPRUSDT | Mapping Out Possibilities | Mid Term (1D)
WLDUSDT | Mapping Out Possibilities | Mid Term (1D)
GODSUSDT | Mapping Out Possibilities | Mid Term (1D)
AXSUSDT | Mapping Out Possibilities | Mid Term (1D)
CHZUSDT | Mapping Out Possibilities | Mid Term (1D)
OGNUSDT | Buy Now, Thank Later | Near Term (4HR)
XCHUSDT | Buy Now, Thank Later | Near Term (4HR)
VRAUSDT | Buy Now, Thank Later | Near Term (4HR)
CSPRUSDT | Buy Now, Thank Later | Near Term (4HR)
PERPUSDT | Buy Now, Thank Later | Near Term (4HR)
TLMUSDT | Buy Now, Thank Later | Near Term (4HR)
DODOUSDT | Buy Now, Thank Later | Near Term (4HR)
LPTUSDT | Buy Now, Thank Later | Near Term (4HR)
VRAUSDT | Buy Now, Thank Later | Near Term (4HR)
XCHUSDT | Buy Now, Thank Later | Near Term (4HR)
CSPRUSDT | Buy Now, Thank Later | Near Term (4HR)
VELOUSDT | Buy Now, Thank Later | Near Term (4HR)
UMAUSDT | Buy Now, Thank Later | Near Term (4HR)
OGNUSDT | Buy Now, Thank Later | Near Term (4HR)
DOTUSDT | Buy Now, Thank Later | Near Term (4HR)
VIDTUSDT | Buy Now, Thank Later | Near Term (4HR)

#DOT/USDT Ready to go higher#DOT
The price is moving in a descending channel on the 1-hour frame and sticking to it well
We have a bounce from the lower limit of the descending channel, this support is at 8.37
We have a downtrend on the RSI indicator that is about to break, which supports the rise
We have a trend to stabilize above the moving average 100
Entry price 8.80
First target 9.32
Second target 9.73
Third target 10.21
