DOTUSDTdot bear? based on this analysis from daily time frame, doge might sell to $3.822
price usually goes as anticipated after taking off liquidity n targeting opposite structure..
i post what i see on my chat. you dont have to agree (i dont even need you to do so), do what your chat says.
and as usual, its NOT financial advice.
DOTUSDT trade ideas

#DOT/USDT is trying to break the Diagonal Trendline in 4-Hour TF#DOT/USDT is trying to break the Diagonal Trendline in 4-Hour TF!
MIL:DOT needs to break the trendline to turn bullish. The local resistance level is PWH $4.919 and the support level is PWL $3.59.

DOTUSDTDOT/USDT Daily Chart: Key Levels & Dates Ahead 🚀
DOT/USDT is approaching a critical support level around $4.60, following a persistent downtrend. Three key dates—October 2, 2024, December 27, 2024, and June 16, 2025—could signal important shifts. Traders should watch for potential reversals or continued declines, with careful attention to risk management.
PS: Remember to go down on TF.
#DOT #CryptoAnalysis #DOTUSDT #CryptoTrading

#DOT/USDT#DOT
The price is moving within a descending channel pattern on the 12-hour frame and is expected to break upwards
We have a downtrend on the RSI indicator that has been broken upwards and we have a tendency to stabilize above it
We have a major support level in green at a price of 4.20
We have a tendency to stabilize above the moving average 100 which supports the rise
Entry price 4.67
First target 5.40
Second target 6.02
Third target 6.70

Is Polkadot going to make lower low?Yellow Line - BOS zone
White Line - Resistance of Bearflag pattern.
This is my idea on BINANCE:DOTUSDT and how it will go. We all know Dot is one of the top altcoins with huge potential. As you can see BINANCE:DOTUSDT is much likely to form a bearflag pattern before it goes up. If DOT ever reaches the 2.5-3 zone I would re-enter Long position again. You may think why 2.5-3 zone? isn't it going to make lower low? For me seeing a lower low is a confirmation that we are in a bearflag pattern and checking the bottom support line 3rd time is a huge confirmation to consider a Long Position. So time will tell!


Bottom is in for DOT I am pretty sure the bottom is in for DOT. Look at the nice pattern it made and look at the beautiful divergence it is making. Boom boom!

DOT - Price hit accumulation zone #DOT/USDT #Analysis
Description
---------------------------------------------------------------
+ DOT price has hit accumulation zone and currently trading inside the accumulation zone.
+ Price is expect to trade in this range for upcoming weeks.
+ A clear breakout from this accumulation zone is essential for the trend reversal.
+ A breakout from the accumulation zone will push the price higher eventually result in a bullish trend.
+ Let's wait for the breakout before entering the trade.
---------------------------------------------------------------
Enhance, Trade, Grow
---------------------------------------------------------------
Feel free to share your thoughts and insights.
Don't forget to like and follow us for more trading ideas and discussions.
Best Regards,
VectorAlgo

DOT Technical Analysis in a Weekly TimeframeHello everyone, I’m Cryptorphic.
For the past seven years, I’ve been sharing insightful charts and analysis.
Follow me for:
~ Unbiased analyses on trending altcoins.
~ Identifying altcoins with 10x-50x potential.
~ Futures trade setups.
~ Daily updates on Bitcoin and Ethereum.
~ High time frame (HTF) market bottom and top calls.
~ Short-term market movements.
~ Charts supported by critical fundamentals.
Now, let’s dive into this chart analysis:
DOT is under a symmetrical triangle pattern and within the accumulation range. Recently, the price reached the lower support of $3.590 and bounced back strongly.
In the long run, DOT looks bullish, and we are likely to see a decent rally once it breaks out above the resistance trendline.
Key levels:
- Accumulation/Support: $3.590 to CMP.
- Primary Resistance: $6.5.
- Long-term Target: 10x-15x gain.
- Invalidation: A weekly close below the $3.590 support level.
DYOR. NFA.
Please hit the like button to support my content and share your thoughts in the comment section. Feel free to request any chart analysis you’d like to see!
Thank you!

Polkadot Pre-2025 Bull-Market Accumulation Zone & Strategy 101Hello my dear friend, how are you feeling today?
➖ The market moves in cycles and each cycle is composed of waves.
➖ After a bearish cycle we have a bullish cycle.
➖ Within each cycle we have bullish and bearish waves.
➖ We can see on the chart that the better part of 2024 has been a major correction. After this correction, we will experience consolidation followed by a major bull-market.
Strategy | Cryptocurrency Trading 101 with Alan Santana
👉 Polkadot has the potential to hit a price of $145 in 2025. We can calculate a range of $125 - $150 to be safe. Knowing this, we can work now on developing our strategy.
The main mistake traders and aspiring traders make consist in either selling too early or holding losers for too long.
Since the correction is reaching its end, we don't have to worry about the "holding losers for too long" part anymore and can focus instead on "selling too early."
We tend to sell too early because we either don't have a plan or just don't know the potential of the pair/project we are holding.
Here, I am sharing with you my plan and also revealing the growth potential.
👉 The strategy is very simple: Buy and hold.
I can buy everything and as much as I can/want below $5, forever and a bit more and hold long-term expecting higher prices. (It is possible also to continue buying once the pair/project starts to grow.)
➖ No leverage, no margin, no risk.
Buy and hold.
That is as simple as it can get.
This is my strategy. You can follow it if you like.
It has been time tested and so far produces amazing results.
Thank you for reading.
Thanks a lot for your continued support.
I am wishing for you tons of profits and success now and in the years to come.
Namaste.
__
Polkadot | DOTUSDT (Current price $4.55)

Polkadot (DOT): Possible Zones of RejectionsPolkadot has made a nice toucch to support zone during that market sell we had earlier this week.
As of now, we are looking for some further movement to the upper resistance zone, where we want to see a good rejection back to the support zone!
Swallow Team

DOTUSDT - who is bullish on crypto?Disclaimer: I don't have a fundamental basis to actually believe in this scenario, but what I see on the chart I see on the chart.
With that out of the way, the shown scenario of an impulse followed by a rather big flat correction, which might be done now, would be extremely bullish, since it would suggest new all time highs (that would be a 13x from here at minimum).
Never only consider one way though, even without changing too much of the count, a not so nice mid/long-term alternative would be this:

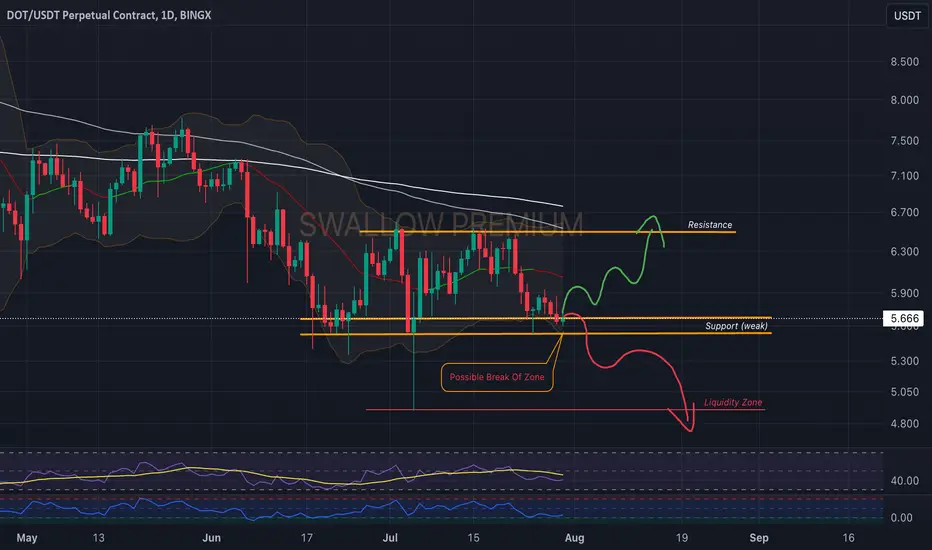
Polkadot (DOT): 2 Scenarios, Which Way Now?Polkadot is in a crucial support zone where the price is testing it. We are left here with 2 possible scenarios: the first would be a breakdown of that support, which would move the price towards $4.90, or the second scenario would be a nice bounce from the current zone, which would result in a good movement to $6.50. As of now, we are waiting for confirmation of eather movement to happen!
Swallow Team

DOTUSDT Long Trade Setup✉️ Pair: DOTUSDT
📈 Direction: Long
💯 Leverage: Cross 5x-10x-20x
📊 Entry: $6.00
✅ Target 1: $6.215
✅ Target 2: $6.534
✅ Target 3: $7.12
✅ Target 4: 🚀🚀🚀
⛔️ Stop Loss: $5.00
Wave (3) should start from here; otherwise, the larger wave (2) is likely to be extended, with support at $5.24.
Manage your risk – never trade more than 1% of your capital on a single trade.
🔔 For more updates, follow me and don`t forget to hit the BOOST :D

Will PolkaDot DOT reach the sky this bullrun?Hello, Skyrexians!
Despite the Bitcoin price fast recovery after correction, altcoins remain dead and we understand that it's really annoying for most of market participants. Most of traders now in huge loss after -60% dump for entire crypto market since March 2024. But crypto trading is very risky to experience it without proficiency in different crypto trading strategies. This time even top crypto bot trading strategies and the best crypto traders failed. Nobody has been waiting for such a big crash. Analyzing ideas of top crypto traders on TradingView we can see that most of them are still bullish. For sure it does not mean that market will definitely do down, but if when it start bouncing they remain bullish mood it's gonna be dangerous signal and different trading tools such as automated trading bots, grid trading bot and other algorithmic trading bots can face with a huge loss again. In our opinion only ai crypto trading bot can overcome this problem because of using non linear approach.
In today's article we are going to share with you our analysis on BINANCE:DOTUSDT to help you setup your crypto trading bot algorithm or trade manually. Hope it will help to avoid mistakes and decrease potential losses. Let's get started!
DOT macro overview
History of this crypto asset has enough bars to make a complex analysis. This fundamentally strong L0 project has been listed in 2020 just before the massive bull run. The previous bull run wave the largest degree wave 1. After that we saw the first sell off. Some traders may tell that it's wave 4, but we counted it as wave A inside the larger wave 2. Wave B set up the bull trap and printed the irregular correction and after that the wave C has started.
In our opinion this wave C inside 2 has been finished in October 2023 with the massive reversal bar at the bottom. This is the strongest signal of trend end. Now the new impulsive wave 3 has been started. We want you to pay attention to the fact that DOT is the uptrend asset, price has not hit the previous bull run start and it's the great sign that in this cycle it has a great chances to set new ATH.
Talking about potential targets we can use our favorite Fibonacci extension. The most conservative target is $51 (almost at the ATH), the likely one is $79 and unbelievable is $119. We expect the reaching at least the first target in $2024-$2025.

Positive Outlook for Polkadot (DOT) PriceDespite the drop in Polkadot (DOT) price earlier this month, investors remain optimistic about this cryptocurrency and continue to invest in it.
The steady increase in capital inflows since mid-month indicates growing interest and confidence in the Polkadot project. These factors suggest a strong belief in the project's potential, which could lead to sustainable price growth in the future.
To confirm a real upward trend, Polkadot needs to break out of the current range between $5.5 and $6.5. If this happens, the price could reach $7.2 and $8.3. The current range is suitable for entry, with a stop-loss for this analysis being a daily candle closing below $5.5.

DOT - USDT 1DIntervalHello everyone, let's take a look at the BTC to USDT chart on a one-day time frame. We can see that the price has moved sideways from the downtrend line, but there is still movement in the smaller downtrend channel.
Let's start by determining the support line and as you can see, the first support in the near future is $5.37, if the support is broken, the next support is $3.94.
Now let's move on to the resistance line, as you can see the first resistance is at $6.87, if you manage to break it the next resistance will be at $8.08 and then strong resistance at $10.09.

Polkadot (DOT) big surge incomingBINANCE:DOTUSDT is one of the coins that underperformed this bull run. At the moment, Dot is priced way too low, with a low RSI of 40. If BINANCE:BTCUSDT surpasses the 74k mark, we will definitely see Dot breaking to the upside from this falling wedge, which has a Target of around 15. Big resistance that have to be surpassed lay at 10.3 and 11.9.

I am entering Long-term Long position on Polkadot!BINANCE:DOTUSDT all time high in early March which is huge sign to go up. As you can see there was a crucial resistance channel holding BINANCE:DOTUSDT since last June. Now BINANCE:DOTUSDT consolidating above it and checked weekly crucial support zone once. I suggest you to look at my last idea on BINANCE:DOTUSDT and where to take profits.

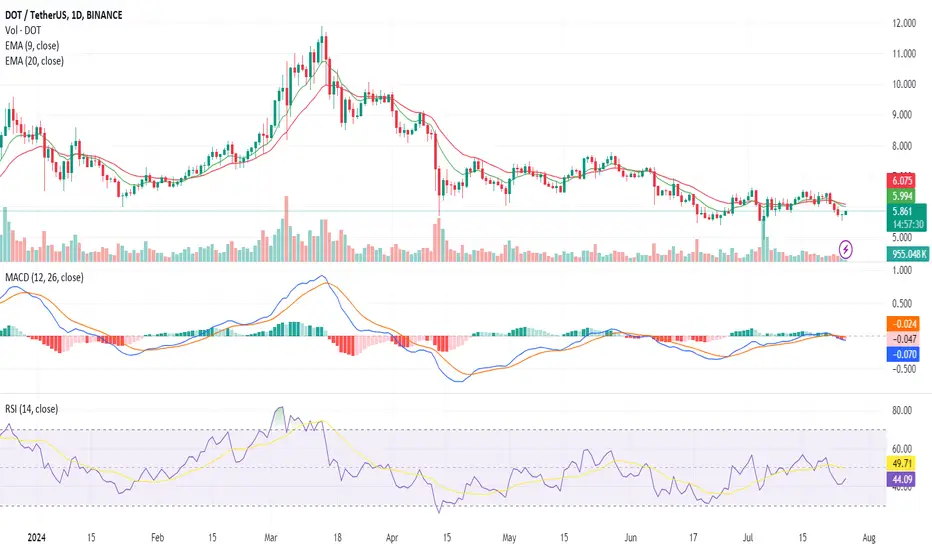
Polkadot Crypto Gains Momentum with Key Technical BreakthroughsIn recent trading sessions, BINANCE:DOTUSDT has exhibited intriguing movements, hovering around key support and resistance levels that could dictate its short-term direction. Closing prices have shown a steady upward trajectory, culminating at $5.862, reflecting a gradual recovery from previous lows.
The 9 Exponential Moving Average (EMA) has been trending upward, currently at $5.797, signaling short-term bullish momentum. However, the 20 EMA, standing at $5.865, has been relatively flat, indicating a lack of strong upward pressure. The convergence of the 9 EMA towards the 20 EMA suggests potential bullish crossover, which traders typically view as a signal for upward movement.
Meanwhile, the Moving Average Convergence Divergence (MACD) indicator is currently presenting mixed signals. The MACD line has been climbing towards the signal line, moving from -0.145 to -0.098. Positive histogram values further indicate that bullish momentum is gradually increasing. However, the MACD is still in negative territory, which suggests caution as the overall momentum has not fully shifted to bullish.
The RSI has moved from oversold levels at 28.68 to a more neutral position at 46.33. This upward movement in RSI indicates waning selling pressure and a potential shift towards a more balanced market sentiment. An RSI approaching 50 often signals a possible entry point for traders anticipating upward price movement.
The immediate resistance levels are observed at $5.866 and $5.937. A break above these levels could pave the way for further gains towards $5.942 for the Polkadot crypto. On the downside, key support levels are identified at $5.829 and $5.759. A dip below these supports could lead to further downside, with $5.679 as a critical support zone.
Traders looking to go long may consider entering a position upon a confirmed breakout above $5.866, targeting the next resistance at $5.937, with a stop-loss just below $5.829 to manage risk. For those anticipating a downturn, a short position could be initiated if the price breaks below $5.759, aiming for the lower support at $5.679. A stop-loss above $5.829 would help mitigate potential losses.
While the technical indicators for the Polkadot crypto are showing early signs of bullish momentum, caution is warranted due to mixed signals from the MACD and the relative positioning of the EMAs. Traders should monitor the aforementioned support and resistance levels closely to make informed trading decisions.

Polkadot(DOT): Back At TrendlineWe are back with Polkadot, where we are yet again on that trendline, which has shown us some decent support since June 18th.
As of now, we are also seeing a good weakness kicking in on the markets so here we are with 2 scenario case where one is bullish and the other is bearish.
What do you think, and which one will we see?
Swallow Team
