DOTUSDT - Still bullish on DOTThe whole crypto market is in downward trend!!
DOt is still holding major support! if Dot surpass 6 dollars.. we will see upward trends...
DOTUSDT trade ideas

DOTCoin #DOT
Accumulation Levels:
4.3 - 3.5 - 3
Average Accumulation:
3.5
Stop Loss:
Weekly close below $2.3
The stop loss will be around 35%, so entry should be with only a portion of the capital.

$DOT - Retest NecklineTarget for double top done already.
Expecting retest the necline to get confirmation.
I am take a long position on DOT
Always use stop loss and always dyor befor take a positioan and make a decision.

DOT Defense Line Coming!!Positioned for a prime breakout higher, however to achieve that mark, it needs to flip 2 essential resistances. Dot faces a turning point sort of resistance at 6.40-6.55 levels. The combination of horizontal and trendlines both meet here.
Stronghold above the trendline opens Dot towards 7.2 primarily followed by 7.60 and 8.40 next.
Decent support at 6.0 and 5.750 levels.

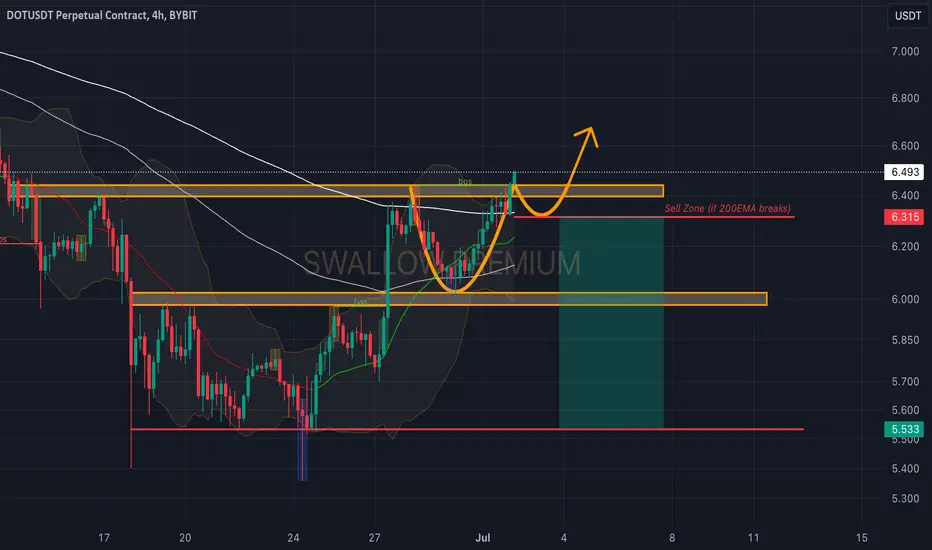
Polkadot (DOT): Potential Cup & Handle Pattern ? Polkadot has broken out of 200EMA and is now looking to break from the final resistance zone.
As we see a new 4-hour candle struggling to break local zones, we are now looking for some kind of rejection. We have 2 scenarios: either we form a cup-and-handle pattern or we will see a rejection from current zones, which would be the start of good downward movement breaking all lower zones!
Swallow Team
DOT ANALYSIS🔮 #DOT Analysis - Breakout 🚀🚀
💲💲 There is a breakout of Falling Wedge Pattern in #DOT and trying to retests the level. It's a 12hr time frame breakout and we will see more higher price in long-term. A successful retest of support could propel a rally 📈📈
💸Current Price -- $6.058
📈Target Price -- $9.051
⁉️ What to do?
- We have marked crucial levels in the chart . We can trade according to the chart and make some profits. 🚀💸
#DOT #Cryptocurrency #Breakout #DYOR


DOT providing a clean Long SetupDOT with a nice bullish market structure break provides a long setup into the buyside liquidity above.
Low hanging fruit target provides the bread.
Good luck :)


DOT's next move.CRYPTOCAP:DOT
I see a bullish divergence on the daily chart at an important support level, and people are freaking out about how they spend money :)
Sorry, but I trust what I see on the charts.
The only invalidation point is $4.50.
If you are still here, here are more of my thoughts...
So what if #DOT paid big influencers to promote their project? Every project does that; it's their marketing strategy. It's good that they are investing in marketing because, in the crypto world, the cycle moves really fast, and to keep up, you need to spend on marketing.
Many projects, including some of your favorites right now, have paid influencers. It's like the death toll shown on your screen daily during the COVID-19 pandemic, which made you worry every day. But in reality, the death toll was almost the same before COVID-19; it was just shown to you daily.
You never know how much #ADA paid influencers. Disliking the idea of paying for and buying inorganic distribution is misguided.

#DOT/USDT is holding the Diagonal trendline as a support level#DOT/USDT is holding the Diagonal trendline as a support level in 1-Hour TF!
CRYPTOCAP:DOT may rejected from PWH $6.435 resistance level. Wait for the rejection/retest to shorten it. The local support level is $6.05.

DOT/USDT: Potential Breakout from Falling Wedge?Hey everyone!
If you're enjoying this analysis, a thumbs up and follow would be greatly appreciated!
DOT/USDT looks good in the daily time frame. Forming a falling wedge-like structure here and trying to break it out. A successful breakout will take the price to bear ATH. Buy some here and add more in the dip.
Entry zone:- $6.04-$6.48
Targets:- $7.4/$8.8/$10.5
SL:- $5.7
What are your thoughts on DOT's current price action? Do you see a bullish pattern? Share your analysis in the comments below!

POLKADOT ... ready for next movehello dear traders and investors
this price action for polkadot with usdt pair … this is very strong supourt zone on the 5.28 $ … after price rejected from 6$
In order for the price to rise further, it needed liquidity, and when it reached the $5.3 area, it took that liquidity and now it is ready to rise...
this is lower time frame The price forming a bullish patern :
In my opinion, the next price station is (13.58 ) the prz area of the harmonic pattern that you can see in the chart...
good luck

DOT :Other Levels To Watch 6.8, 7.2 and 7.6DOT :Other Levels To Watch 6.8, 7.2 and 7.6
From our previous analysis, DOT confirmed the bullish movement and already reached
the first target.
The break out of the last 6.00 resistance area looks to be very strong and may stop the price from going lower even if it tests it again.
Considering from the shape it is already taking we may see DOT rising further following the
other targets 6.8, 7.2 and 7.6
You may find more details in the chart!
Thank you and Good Luck!
❤️PS: Please support with a like or comment if you find this analysis useful for your trading day❤️

DOT Price DOT token persisted in forming the lower low swings and made a descending triangle pattern.


DOTUSDT - Bullish Strenth shown in RSI -Broken falling wedge DOTUSDT haven't done good progress in this bull cycle so far and retest it major support.
The structure is still sustain, I can see a great upside potential.
Take Profit target are high lighted. (7.7,9.3,10.5) USDT is on the cards.
Bullish divergence has formed on daily time frame and expecting to hit targets in next couple of weeks.
happy trading and keep learning

POLKADOT - UPDATE -$20 INCOMING AFTER THIS POSSIBLE LAST RETRACE
This is an update on $dotusdt. It now seems clear to me that we have completed the primary degree wave 1-yellow and we are in some kind FLAT for wave 2-yellow which we will be ending coming days or weeks at around the 50-70% Fibonacci zone.
The next point of interest or right place to DCA is anywhere withing the box. Remember I warned you about all these huge pullbacks happening and I told you to position yourselves by buying in parts and not diving in all at once.
Also do not forget that we might not see the last leg (wave 5-green) and the whole FLAT might become a combo making it a RUNNING FLAT thereby moving price to the next target at $15 and above. That is why we don't wait for perfect entry instead we DCA in.
OTHER ANALYSIS

POLKADOT
Other than fundamental analysis that could alter this, BINANCE:DOTUSDT have no business going any lower. We have been accumulating Polkadot for a while now and we're well averagely.
PREVIOUS ANALYSIS
OTHER ANALYSIS
BINANCE:CYBERUSDT
BITFINEX:APEUST
BINANCE:BTCUSDT
OKX:BLURUSDT
MEXC:AZEROUSDT

Rounding Bottom Formation Looks like a rounding bottom is being formed. Coincides with the breakout currently.

Price holds above 6 USD . Time to go Long Price holds above 6 USD . Switches to retracement after breakout .
Long to 8.5 USD

Recharted : DOT to fall below 5 USDRecharted my previous view for a more accurate long term view. Price dropped below major support at 5.8 and retraced.
Looks like the fall will continue to the 4 USD region still

DOTUSDTPolkadot (DOT) retraced to the golden pocket after a very good impulse to the upside from the bear market low. This is looking like a very promising chart. It can have a good impulse to the upside for its Wave 3.
