DOTUSDT.PHello Trader BINANCE:DOTUSDT.P
triple top low time frame. Possible breakdown first can be in the market price or limit entry area 7,301 - 7,343 take profit 10% stop loss 2%
Please add a comment and Positive feedback and constructive criticism are important to authors and the community.
Disclamer: Not Financial Advice
DOTUSDT trade ideas

#DOT/USDT#DOT
We have a bearish channel pattern on a 1-hour frame, the price moves within it and adheres to its limits well, and it is about to break upwards.
We have a tendency to stabilize above moving average 100
We have a downtrend on the RSI indicator that supports the price higher
Entry price is 6.80
The first goal is 7.07
Second goal 7.24
Third goal
7.45

$DOT Bullish Dragon / Break Hook & GoReal nice setup here on DOT, one of the most undervalued alts paired against BTC. We've been watching this one for awhile, anticipating the move on the BTC pair, and its been setup real nice here on the daily USDT pair.
Bullish dragon here, with a potential wave 1 up, wave 2 down.
Broken outside of the downsloping supply line and retested, a classic break & hook
Really want to see the local high at 7.58 broken, to confirm the double bottom and give more confidence to the idea that a 3rd wave is now under way.
Looking for 9$ as a first target, which would be a potential pivot level at the 618 retracement, which is confluent with a 1618 extension of wave 1 up. Above that, the 2.0 and 2.618 extension levels would be likely, as id expect a full return for the imbalance at the top of the dragon.
Risk management should always be expressed and all targets should be profit taking levels with the potential to become reversal zones.

Chart Signals Opportunity: Is DOT Poised for Takeoff with DED The DOT/USD chart shows an interesting development with a potential breakout from a falling wedge pattern. The price has broken above the resistance trendline and could potentially reach the target zone of $9.50-$10.50 based on technical analysis. It's worth noting that the upcoming DED token airdrop might be influencing the current accumulation. However, remember that airdrops are speculative events, and their true impact is uncertain. This is not financial advice, and other factors are crucial before investing. What are your thoughts on this potential breakout and the airdrop's influence? Remember, always do your own research and consult a financial advisor before making investment decisions.

DOTUSD my long term vision My long term vision on Polkadot , i think it's ready to make another ATH , if you missed the first dip at 4 - 5$ still buy opportunity .
Good Luck

#DOTUSD_#BearishScript is printing series of LH & LL, a quick scalping can be done on the levels identified on the charts based on the bearish Engulfing candle stick pattern which was printed on the last close candle stick.
#DYOR (Do Your Own Research)

PolkaDot. In The Golden Pocket.Market Cap 6.9 Billion
Up a cool 2,600% before a RSI Bearish Divergence + the "Incredible Sell" , price retraced to the 0.5 fib level, before rallying again to its high of $55.
Price has since corrected 88% and finds itself in the Golden Pocket.
We also have our first "Incredible Buy" Signal + Stochastic Oversold.
Does that mean the bottom is in? Don't know, I don't try timing the tops or bottoms.
Long Term bulls should DCA (Dollar Cost Average) with re-entry at $4, which is the 0.786 fib level , some big Volume Profile can be found there.
Can price drop further? Most definitely!
Speculative Setup, DYOR. Allow 3-18 Months For all Crypto Ideas.
Credit to @without_worries for allowing use of indicators.

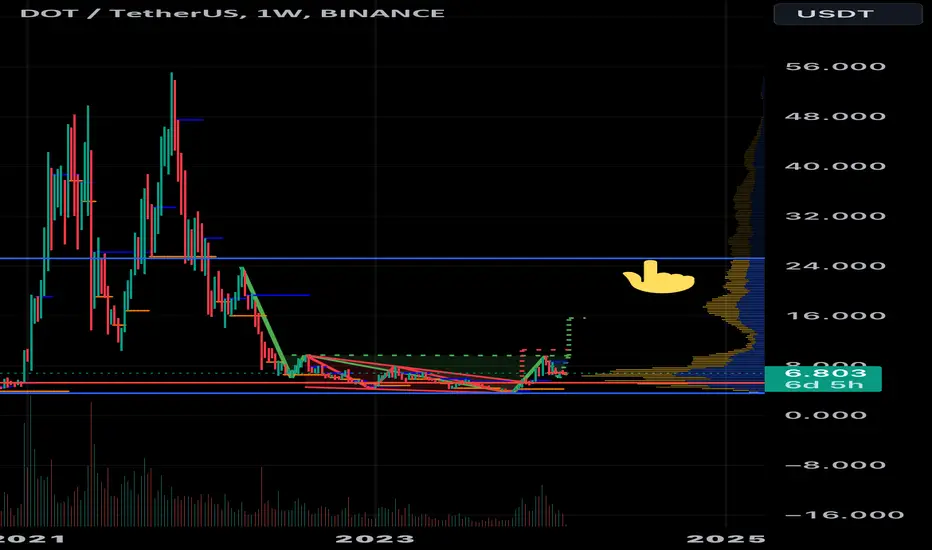
DOT/USD Weekly Chart Shows Intriguing Signs - $25 Weekly VAH in Possible Wyckoff Accumulation:
The weekly chart does exhibit some characteristics of a Wyckoff accumulation phase, including a period of price consolidation with decreasing volume.
However, identifying a definitive Wyckoff pattern can be subjective and open to interpretation.
Target Zone of $15-25:
If a true Wyckoff accumulation is underway, the price could potentially reach the proposed target zone of $15-25 after a markup phase.
It's important to remember that this is just a hypothetical target based on a specific technical analysis interpretation.
Crucial Considerations:
Confirmation Matters: Reaching the target zone requires confirmation through increased volume, breakouts above resistance levels, and sustained momentum.
Not Guaranteed: Past performance is not indicative of future results, and technical analysis is not a perfect science.
Broader Market Impact: Stay informed about overall market trends, news events, and regulatory developments that could influence DOT's price.
Risk Management: Always prioritize risk management with a stop-loss order, regardless of technical analysis or price targets.
Remember:
This is for informational purposes only and should not be considered financial advice.
Conduct thorough research, understand the inherent risks involved, and always consult with a qualified financial professional before making any investment decisions.
Further Exploration:
Analyze other technical indicators (RSI, MACD, etc.) for a more comprehensive picture.
Consider fundamental factors like Polkadot's development progress, adoption, and competitive landscape.
Research different interpretations of the Wyckoff pattern and potential alternative scenarios.
DOTUSDT: Bullish PatternDOTUSDT.P is trading in symmetrical triangle pattern and recently forming Bullish Divergence on 2hr time frame. and also break the pattern, but still we will wait for the breakout of the previous LHs for the confirmation of the bullish Trend and take a long ride.
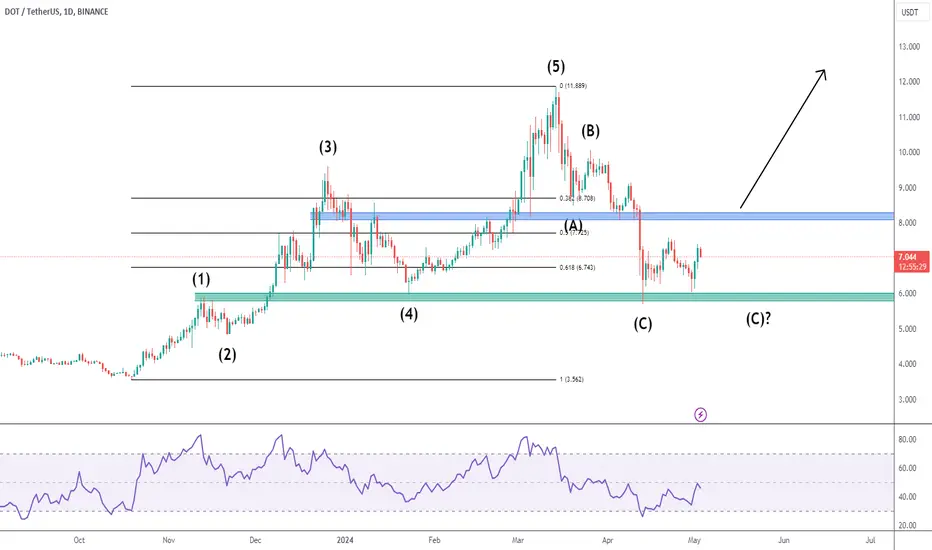
DOT/USDTIn my opinion, wave 2 is completed and I will buy for wave 3 with the goals specified in the chart. The game of altcoins has just started.

DOTUSDT - Bullish TradeDOTUSDT in Bullish trend with symmetrical triangle chart pattern is indicating continuation of bullish trend.

DOT/USDT 4HIntervalHello everyone, let's look at the 4H DOT to USDT chart, as you can see the price is moving in a sideways trend channel where it is holding at the upper part of the range.
Let's start by setting goals for the near future that we can include:
T1 = $7.51
T2 = $7.92
T3 = $8.40
AND
T4 = $9.08
Now let's move on to the stop loss in case of further market declines:
SL1 = $6.82
SL2 = $6.45
SL3 = $6.19
AND
SL4 = $5.85
The RSI indicator shows how we have bounced off the trend line, while the STOCH indicator remains at the upper limit, which may also indicate an attempt at price recovery.

Near Term Outlook: BullishBINANCE:DOTUSDT
Polkadat price formed the price floor of 5.70 and broke the supply area of 6.87 and the price MACD is above zero. From the point of view of buyers, breaking the resistance of 7.50 can start an upward trend in the short term until the next resistance of 8.83. For sellers, the 6.87 low could trigger a bearish move towards the 5.70 support.

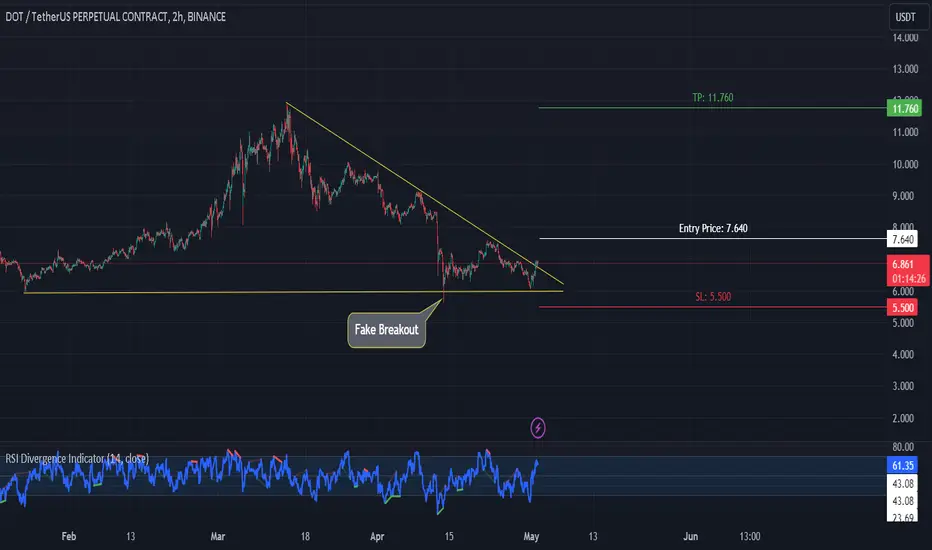
DOT Correction AnalysisDOT finished a 5-wave cycle which is now being corrected.
Wave C could have finished in the green support zone, but I don´t rule out another leg down.
The break of blue resistance will be very bullish.
DOTUSDT is BullishDOT has given a breakout after divergence was formed on four hourly time frame, it made a higher high followed by a higher low, and now seems to be on course for a bullish reversal. Targets are mentioned on the chart.

DOT-USDT - Looks for Key levels that are definedI am expecting another down wave pattern because I can't see any divergence.
Alts will definitely depends on BTC movement and I am still suspecting that market will go down further on this weekend before any upward movement.
Looking for key Level that are defined.

🟢 DOT Trading Plan 📈Market Analysis:
DOT is holding a higher timeframe range high as support, forming a double bottom pattern, indicating potential readiness for an upward move, contingent upon overall market stability.
Trade Setup:
Entry: $6.8 - $7.
Take Profit: $8 or next resistance around $9.5.
Stop Loss: $5.7.
Risk Management:
Utilize a stop loss at $5.7 to mitigate potential losses.
📊 Trade Strategy Rationale:
Anticipate a bullish move in DOT given the formation of a double bottom pattern and support at a higher timeframe range high.
📈💡 Stay alert for market stability and DOT's price action! #DOTTrading #CryptoAnalysis 🌐🚀

$DOT - Breaking out from a massive falling wedgeCRYPTOCAP:DOT has been trapped in a falling wedge that started forming in March after almost touched the 12 usd mark, and just broke out yesterday printing a CHOCH and potentially drawing a higher low in the next hours. Currently the price looks extremely bullish to me and if the plan goes well, we could see it reaching 8 or 9usd very soon.
Beware also that an important EMA passes right around 7.5usd, and price might not break it. In this scenario the price could revisit the entry point or even lower, so don't hesitate to take profit if you feel to.
CRYPTOCAP:BTC LOOKS MID-TERM BEARISH AND CAN RUIN THE PARTY, SO TRADE WITH CAUTION.

BUY POLKADOTDue to porpular demand I will be breaking down crypto. Polkadot looks bullish from this lows of 6.90 I expect price to rally up to 11.30 which will act as our next supply level. Lets catch some coins.

Dotusdt fakeout dotusdt fakeout
its my anaylasis lets c whats happened
thnx me later
hahahahahaha
4.33 tp

A DOTUSDT chart per request.It was requested in the comment section of a previous chart I posted what I thought about the DOTUSDT chart so here I am taking a look at it on the weekly chart. We can see here how as soon as polkadot reache its full double bottom breakout target that it began a big correction…in doing so here it completed a head to a potential head and shoulders pattern and since it bounced from that low it is now forming the right shoulder to that head and shoulders pattern. f it were to validate the breakdown below the purple neckline of this head and shoulders pattern the full breakdown target would actually be even lower than the price range of our double bottom patterns lows. Because of this, I think this greatly reduces the probability that the pattern would hit its full breakdown target. Also since we are currently in the macro bull market cycle phase bearish patterns don't hit their full 100% targets as often. There is still a slight possibility it could hit the full breakdown target but imo that would likely have to coincide with a pretty severe black swan event to blame it on as a scapegoat. I think as long as we avoid some sort of crazy black swan in the coming months, that there is a higher probability the head and shoulders pattern doesn’t validate its breakdown. What to watch in order to know which way this will pan out is whether or not the top trendline of the yellow channel (aka the neckline of the double bottom) can maintain support on the weekly channel. Considering how the weekly50ma(in orange) is now coming up to overlap that trendline as double reinforced support, it’s wise to watch for price action to hod support on the weekly 50ma as well. Hopefully thisMA will help lift price action up and bounce it upward. As long as the weekly 50ma maintains that support the h&s pattern will not be validated. *not financial advice*

dotusdtHello friends, dot is trying to form a head and shoulders pattern in the weekly time
I think it should move to higher targets

Polkadot(DOT): Rejection At 100EMAThe next coin we are keeping an eye on is the Polkadot coin, which has a good chance of further moving to the upper zones, yet just as good a chance of seeing full rejection from EMAs.
We are looking forward to price action, and to be honest, we want to see a touch of 200EMA before fully turning to lower zones, but if we see it happening from a rejection of 100EMA, we will not be surprised!
Also, RSI is approaching the overbought zone, so keep an eye on this one as well!
Swallow Team
