$DOT Analysis 1DTF🚀 CRYPTOCAP:DOT Analysis
📊 Daily Timeframe:
🔻 Moving within a Descending Parallel Channel
📍 Trendline Resistance: $5.6
⚡ Breakout Zone: $5.6 - $5.8 for bullish confirmation
👀 Keep an eye on price action—breakout could trigger momentum!
DOTUSDT trade ideas


Polkadot - Macro VisionAs you can see, we have a macro range in construction.
The new Higher was very little low from the previously, but the good think its the Lower its higher from the recent one, so about this we have good and bad signs.
In that case, we need to wait for mor clarification, 1st that we need its a new Higher High on 4h tf, until that, we can retest demand zone like in 4 november, ant thats not good at all beacause will be to much pressure for the buyers , they acctually stressed a lot because a lot of them, didnt sell what they'v accumulated in the first Low from last year so, they are kind of desperate now for the liquidity and a new low can activate them to sell in loss , also because under 3.5 , there is a chance to visit 1.8 , and that means another -50% for their bags.
Offcourse, this is the bearish scenario.
The bullish one is that we have on daily a rejection from demand zone, this zone was bought very fast from buyers so , we need to see a recovery, a fast one to add optimism in market. Also , everyone , one month ago said that February its a bullish month , and this time looks different so, many of theese investors, now , are confused a lot. A bullish weekly close can activate them again , but until then, they will be very precaute.
My case: Im bullish bettwen 3.5 and actual price for accumulaton on SPOT.
On trading , i will not do nothing for now.

DOT ANALYSIS📊 #DOT Analysis : Update
✅There was a formation of Falling Wedge Pattern on daily chart🧐
We could expect a bounce from its major support zone.
👀Current Price: $4.930
🚀 Target Price: $6.400
⚡️What to do ?
👀Keep an eye on #DOT price action and volume. We can trade according to the chart and make some profits⚡️⚡️
#DOT #Cryptocurrency #TechnicalAnalysis #DYOR

DOTUSDT.1DMarket Structure & Key Levels:
Current Price & Trend:
DOT is trading at $4.962, reflecting a -1.19% decline.
The price has formed lower highs and lower lows, characteristic of a bearish market structure.
Key Support & Resistance Levels:
S1 ($3.637): A critical support level, which has previously acted as a strong accumulation zone.
R1 (Descending Resistance): A key trendline resistance, which DOT must break to signal a potential trend reversal.
R2 ($8.089): A significant resistance zone, marking previous failed breakout attempts.
High: $11.889 (last major peak).
Low: $3.590 (historical bottom).
Technical Indicators & Market Sentiment:
🔹 Trendline Analysis:
DOT is currently trading below R1, maintaining a downtrend structure.
A break above R1 could be the first sign of a trend shift, opening the path for higher targets.
🔹 Potential Bullish Reversal Scenario:
If DOT successfully breaks R1 and holds above $5.50, a rally toward $6.50-$7.00 is likely.
A strong breakout above $8.00 would confirm a trend reversal, targeting $10-$12 in an extended rally.
🔹 Bearish Breakdown Scenario:
A rejection at R1 or failure to hold above $4.50 could lead to a retest of $3.63 (S1).
A break below $3.60 would be extremely bearish, potentially dragging DOT toward $3.00 or even lower levels.
🔹 Liquidity & Volume Analysis:
Current buying volume is weak, indicating hesitation among bulls.
A spike in volume is necessary to confirm a valid breakout above trend resistance.
🔹 Market Psychology:
The $5.00-$5.50 zone is a critical decision area, where DOT needs to reclaim momentum to shift sentiment bullish.
A breakout above R1 could trigger a wave of FOMO buying, while rejection could increase selling pressure.
Conclusion & Trading Strategy:
Given the current price structure, my trading plan involves two key scenarios:
1️⃣ Bullish Breakout Strategy:
If DOT breaks R1 and holds above $5.50, I will enter a long position, targeting $7.00-$8.00.
A confirmed move above $8.00 could propel price toward $10-$12 in the mid-term.
2️⃣ Bearish Retest & Potential Breakdown:
If DOT fails to reclaim $5.50 and starts declining, I will look for a shorting opportunity toward $4.00-$3.60.
A break below $3.60 could lead to a capitulation event, sending price to lower levels.
Risk Management:
Stop-loss for longs: Below $4.50 to avoid false breakouts.
Stop-loss for shorts: Above $5.50, as a breakout could invalidate the bearish thesis.
Leverage approach: Conservative, due to the high volatility and uncertainty in DOT's trend.
Final Thought:
DOT is currently in a bearish market structure, but a break above R1 could initiate a trend reversal. The next few days will be critical, as buyers must step in to prevent further downside. I will be monitoring price action closely, particularly around $5.50 and $3.60, to determine the best trading approach.

DOT bullish move 100%Hello Birdies,
A new bullish move is aligning on the DOTUSDT. This is a new experimental setup I a trying in my arsenal. So DYOR before taking trade.
The entry price is from $4 and exit price is around $9-$10.

DOT - Time to buy again!The price has formed a Triangle on the 4h time frame, and if it breaks out, it can drive the price up to around $6 .
Give me some energy !!
✨We spend hours finding potential opportunities and writing useful ideas, we would be happy if you support us.
Best regards CobraVanguard.💚
_ _ _ _ __ _ _ _ _ _ _ _ _ _ _ _ _ _ _ _ _ _ _ _ _ _ _ _ _ _ _ _
✅Thank you, and for more ideas, hit ❤️Like❤️ and 🌟Follow🌟!
⚠️Things can change...
The markets are always changing and even with all these signals, the market changes tend to be strong and fast!!

DOT/USDT 1W 🩸 CRYPTOCAP:DOT ⁀➷
#Polkadot. Macro chart Another
💯 Intermediate Target - $16
🚩 Macro Target 1 - $23
🚩 Macro Target 2 - $35
🚩 Macro Target 3 - $52
- Not financial advice, trade with caution.
#Crypto #Polkadot #DOT #Investment
✅ Stay updated on market news and developments that may influence the price of Polkadot. Positive or negative news can significantly impact the cryptocurrency's value.
✅ Exercise patience and discipline when executing your trading plan. Avoid making impulsive decisions driven by emotions, and adhere to your strategy even during periods of market volatility.
✅ Remember that trading always involves risk, and there are no guarantees of profit. Conduct thorough research, analyze market conditions, and be prepared for various scenarios. Trade only with funds you can afford to lose and avoid excessive risk-taking.

DOT/USDT: Analyzing the Downtrend and Key Support LevelsDOT/USDT is on downtrend
The entire Market try to confuse with the low volutality and slow movements.
DOT tried to break resistance on 5.27 area but instead it grabbed the shorts and stop losses and tried to convince you guys to open Longs.
Clearly it is a bull trap cause it's next move is to go after Longs. And believe me they are a LOT..
Next Bull run is still couple of months away. Not sure yet as BTC/Dom rising steady. While BTC/DOM will reach 6000 then will be the perfect moment for longs.
But at the moment try to avoid Long positions especially with high leverage.
DOT will retest 4.3 area, it might push it a bit lower. We will see how market react then!
Spreading your capital in this case would be ideal and not to open Big positions straight away.
Remember, we are not day traders ,our job is to identify the trend!
Stay safe and trade with extra cautious.. If you will open Shorts try to be covered at least 23.5% in the opposite direction.
TRADE SAFE

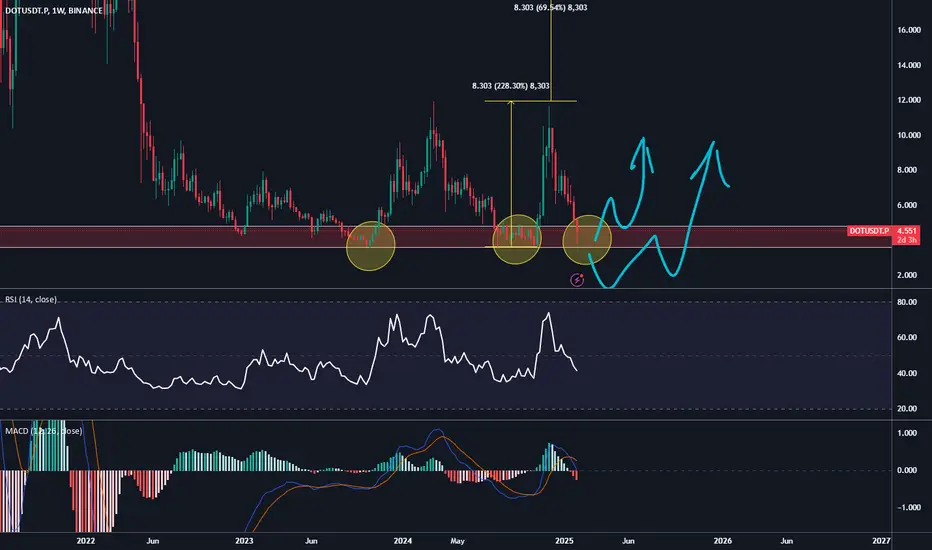
Last Shakeout Has Happened For PolkaDot DOTHello, Skyrexians!
We have seen many negative reactions on our recent analysis on XRP where we pointed out that it it in the distribution zone. We don't understand the sense t hold such overbought asset. Even if growth continues the potential is very low. It's much better to take a look at assets which are still at the bottom, like $BINANCE:DOTUSDT.
On the weekly time frame we can see that DOT tested the support level again and formed the confirmed green dot on the Bullish/Bearish Reversal Bar Indicator . This is the strong signal for the corrective global wave 2 finish. The next target is 1.61 Fibonacci extension at $88 at least. The maximal target is much higher at 2.61.
Best regards,
Skyrexio Team
___________________________________________________________
Please, boost this article and subscribe our page if you like analysis!

DOTUSDT SLIGHT BULISH"After a few days, I can see a bullish movement in DOTUSDT for the short term.
This analysis is based on recent candles, and the targets are close together, making them achievable in the short term.
Note: Please pay close attention to the danger zone and stop loss levels to manage your positions effectively.
Note: My ideas are not intended for any type of scalping or scalpers!
You can find the full list of my ideas here: www.tradingview.com
Here are some of my ideas:

DOT Holding Strong – A Rally to $11 Incoming?DOT has been consolidating within a well-defined range between support zone Green a $3.499 - $3.852 and the resistance zone Blue at $10.203 - $11.090 for an extended period. Recently, the price rebounded from the lower boundary of this range, signaling potential upward momentum. If bullish strength persists, in the coming days, DOT is expected to move toward the upper resistance marked in Blue, provided the bullish momentum continues.

dotusdtdot may come and fill fvg before one more high at least and then back to the lows . never trade without sl .

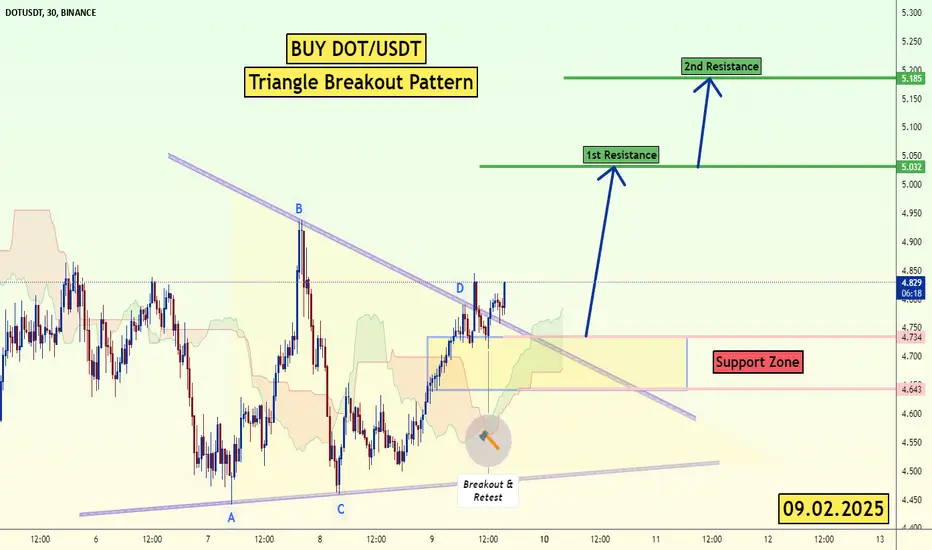
DOT/USDT Triangle Breakout (9.02.25)The DOT/USDT pair on the M30 timeframe presents a Potential Buying Opportunity due to a recent Formation of a Triangle Breakout Pattern. This suggests a shift in momentum towards the upside and a higher likelihood of further advances in the coming hours.
Possible Long Trade:
Entry: Consider Entering A Long Position around Trendline Of The Pattern.
Target Levels:
1st Resistance – 5.03
2nd Resistance – 5.18
🎁 Please hit the like button and
🎁 Leave a comment to support for My Post !
Your likes and comments are incredibly motivating and will encourage me to share more analysis with you.
Best Regards, KABHI_TA_TRADING
Thank you.
Be careful with DOT !!!The price has formed a bullish wedge on the 1h time frame, and if it breaks out, it can drive the price up to around $5.
Give me some energy !!
✨We spend hours finding potential opportunities and writing useful ideas, we would be happy if you support us.
Best regards CobraVanguard.💚
_ _ _ _ __ _ _ _ _ _ _ _ _ _ _ _ _ _ _ _ _ _ _ _ _ _ _ _ _ _ _ _
✅Thank you, and for more ideas, hit ❤️Like❤️ and 🌟Follow🌟!
⚠️Things can change...
The markets are always changing and even with all these signals, the market changes tend to be strong and fast!!

Will Dot break the barrier of the inheritance channel?Hello everyone, let's look at the 1D Dot chart to USDT, in this situation we can see how the price moves in a local strong tendu inheritance channel.
However, let's start by defining goals for the near future the price must face:
T1 = = $ 5.31
T2 = = $ 6.14
Т3 = 6.70 $.
T4 = $ 7.63
Let's go to Stop-Loss now in case of further declines on the market:
SL1 = $ 4.47
However, we still have a very strong support zone that has repeatedly maintained the price from a further correction zone from $ 3.95 to $ 3.56.

Polkadot (DOT): Looking For Another 25-30% Drop / Be Careful!Polkadot has been trading inside a sideways channel where we had a decent rejection from the resistance zone and now price has fallen below the branch of EMAs.
We are looking now for another 25-30% decline to happen here as long as sellers maintain the dominance below the EMAs like they did after a similar situation on the 11th of April!
Swallow Team


DOT USDT💰 #DOT
CRYPTOCAP:DOT Polkadot is approaching a major support zone within a falling wedge pattern 🔍
If support holds, expecting a bounce towards $7.988, $10.060, and $12.327 🎯

Polkadot (DOT): Plan A Being Executed!!! Looking For MSBSince last time we had 3 different scenarios for the coin where "Plan A" took the lead and sellers are slowly taking over zone by zone.
Currently, after the dominance near the resistance zone, we are looking now for a smaller MSB to form, which then would send price to even lower zones so let's see how we end up here!
Swallow Team

DOT/USDT Weekly Analysis🔹 Key Resistance & Spot Trigger:
The chart indicates a major resistance level around $10.465, where the price previously faced rejection. This zone acted as a spot trigger, leading to a sharp decline in price.
🔹 Price Action & Trend:
After the rejection at the resistance, the price dropped significantly, aligning with the downward movement of the orange moving average. Currently, the market is testing a key support zone between $3.90 - $4.50.
🔹 Volume Analysis & Sales Pressure:
The increase in sales volume suggests that sellers are still in control. However, if the price finds strong support in the highlighted box, we may see a potential reversal or accumulation phase.
🔹 Future Outlook:
📉 If the support fails, further downside towards lower historical levels is possible.
📈 If buyers step in, a recovery towards the $6 - $7 resistance zone could be expected.
💡 Trading Plan: Watch for bullish signals within the support area before entering a position. Confirmation via volume and candlestick patterns will be crucial.

We are so close!I love Polkadot and community of this coin. We all know BINANCE:DOTUSDT made huge impulse about a year ago and still consolidating around it. Checking 4.5 area is crucial for BINANCE:DOTUSDT , because that means it is triple bottom which is a huge reversal pattern. If we ever see candle below 3.5 that is the point we consider Long-term long position in either Spot or Futures. Also MACD and RSI making divergence in 1W timeframe.
I will be taking profits at 20, 24, 32, 55 ( ATH ).
TradeCityPro | DOTUSDT Weekly Range Boxes of Altcoins👋 Welcome to the TradeCityPro channel!
Let’s analyze DOT, one of the popular cryptocurrencies, and identify its potential entry points.
🌐 Overview Bitcoin
Before diving into the DOT analysis, let's check Bitcoin on the one-hour timeframe. Due to today's NFP news, Bitcoin has experienced volatility and once again got rejected from the critical $100,000 psychological resistance.
This rejection has led to selling pressure, pushing Bitcoin back toward the 96,445 support, which now has a higher probability of breaking due to this rejection. Additionally, Bitcoin dominance remains within the defined range, showing a slight upward bias.
If we see a correction, altcoins are likely to experience further declines, and I don't expect any major movements until the end of the week.
🕵️♂️ Previous Analysis
In our previous DOT analysis, we expected a decline after breaking $6.554, leading to a test of the daily range high. However, recent market conditions caused DOT to wick down as low as $3.743, which is its strongest support level.
📊 Weekly Timeframe
DOT remains inside its weekly range, and despite its 170% range, it is still considered ranging rather than trending.
I've previously discussed "money traps", and this applies here too. You can buy at $3.719, but without momentum, your capital could remain stuck in this asset for a long time. Who knows—could DOT be the next LUNA?
Considering these factors, I prefer either a strong reaction at $3.719 or a breakout above $10.309 before entering a position. I’d rather focus on coins that confirm a breakout before entering**, like Jasmy, which recently provided a 400% gain.
For exiting, if $3.719 support breaks, it's better to accept the loss and exit. Later, if a buy signal reappears, you can re-enter using the same USDT amount, instead of holding and losing more DOT.
📈 Daily Timeframe
On the daily timeframe, DOT faced a strong rejection at $10.725, forming consecutive lower highs and lower lows. However, recent selling pressure appears to be weakening, and we are currently sitting on the $4.626 support.
Additionally, a trendline is forming, and if DOT rejects from it in the future, this would indicate continued bearish momentum, providing an opportunity to keep short positions open from higher levels.
I personally believe DOT may enter a range for some time, allowing traders who made emotional decisions due to FOMO and market volatility to reassess. For now, I expect the $3.719 support to hold.
That doesn’t mean we should buy immediately. Our strategy is clear , buy after a breakout above $10.725 , Wait for an accumulation range to form or Look for a sharp upward move, retest a key trigger level, and confirm a breakout before entering.
