DOTUSDT - The Monster!It would be a shame if you’ve lost hope in DOT like many others have recently.
This is a strong project with a large market cap, and in every bullish season, it delivers solid performance — not explosive, but consistent. A moment will come when you’ll regret not buying it at $4.
From an investment perspective, its minimum long-term target is $40, while its more conservative mid-term target is $10.
Currently, the coin has broken out of a falling wedge pattern with a successful retest and has crossed above the 25 EMA on the 3-day chart.
These are all bullish indicators and a clear opportunity, especially with a nearby stop loss at $3.5.
Best regards:
Ceciliones🎯
DOTUST trade ideas

Polkadot (DOT): Aiming To Reach here $5.00-$5.40Polkadot still looks good, even after the pullback, which left the price basically near the area where we started the whole upside game plan. Targets remains the same; R:R for this trade is good as always!
More in-depth info is in the video—enjoy!
Swallow Academy

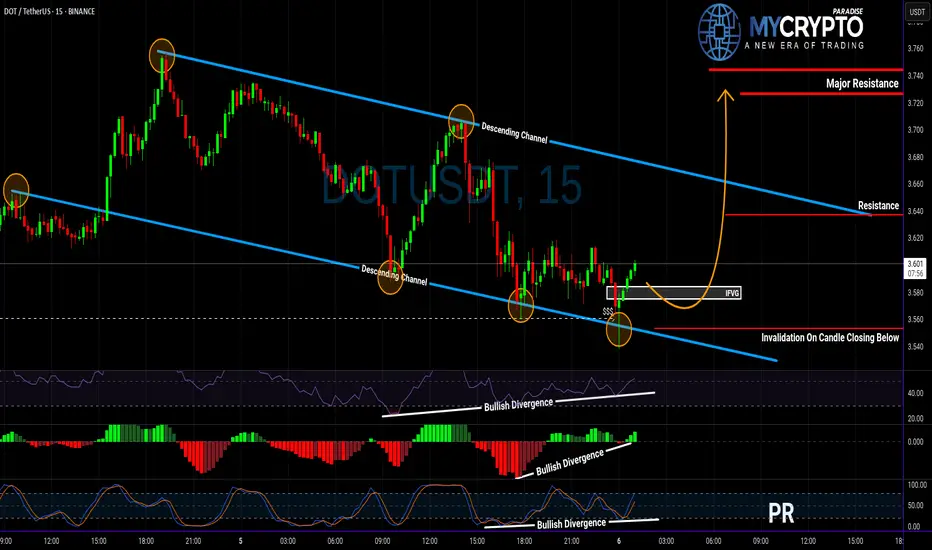
DOT About to Explode or Collapse? Read This Before Entering!Yello Paradisers, are you watching DOT closely? Because this setup could either give aggressive traders a golden entry—or wipe out the impatient ones 👀
💎DOTUSDT is showing strength after sweeping liquidity and now sitting right at the supportive trendline of its descending channel. What’s catching our attention is the clear bullish divergence on RSI, MACD, and Stoch RSI, which together boost the probability of a bullish breakout from here.
💎If we get a pullback, the IFVG zone (Inverse Fair Value Gap) below offers a clean setup for a high RR (risk-to-reward) trade. That would be a more strategic entry for patient traders. But for those who trade more aggressively, the current price is already offering a decent RR setup—just remember, this is not advisable for beginners. Patience and discipline remain key, especially in uncertain zones like this.
💎However, if DOTUSDT breaks down and closes a candle below our invalidation level, the bullish scenario is completely off the table. In that case, the smartest move is to step aside and wait for better confirmation before making any decisions.
🎖Strive for consistency, not quick profits. Treat the market as a businessman, not as a gambler.
MyCryptoParadise
iFeel the success🌴
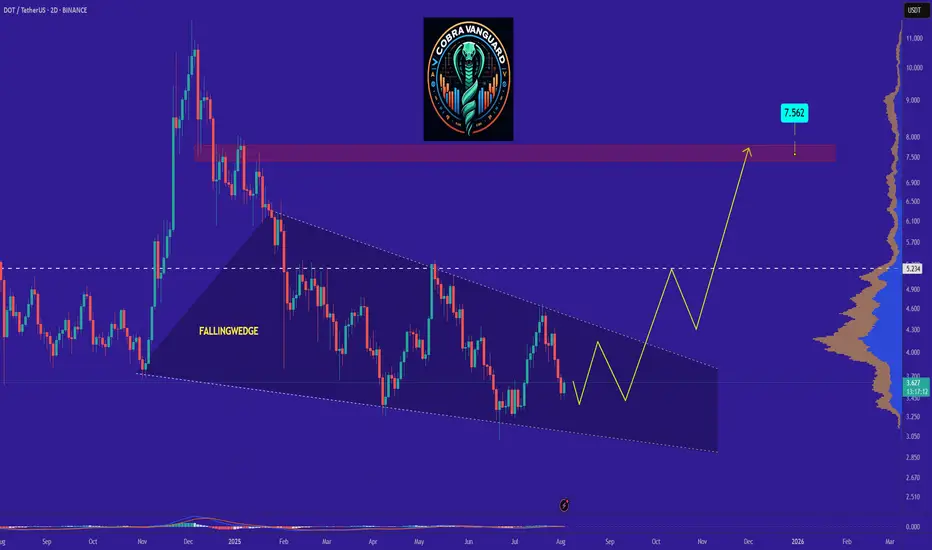
DOT is bullish now and many Traders don't see itSo if you pay attention to the DOT chart you can see that the price has formed a Ascending wedge which means it is expected to price move as equal as the measured price movement.( AB=CD )
NOTE: wait for break of the WEDGE .
Best regards CobraVanguard.💚

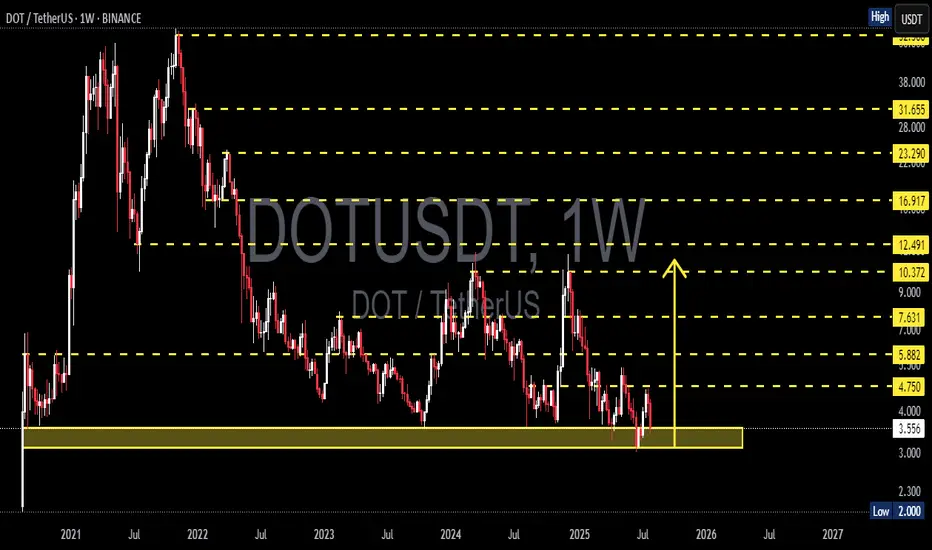
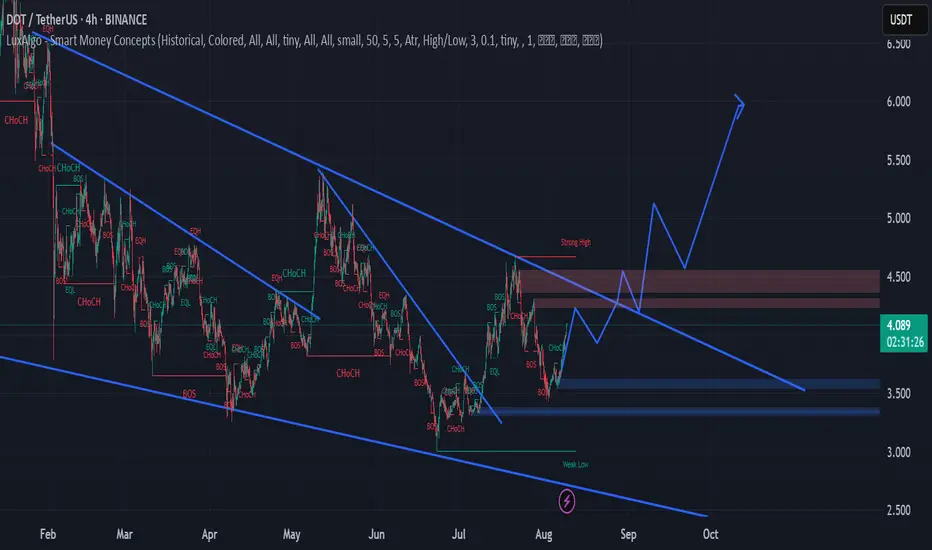
DOTUSDT On the Edge of a Major Rebound or a Devastating BreakdowPolkadot (DOT) is once again retesting one of its strongest macro support zones between $4.00 – $3.55, a historically significant demand area that has provided major price bounces since mid-2022.
This isn’t just a random level—it’s a critical accumulation base where large buyers have consistently shown interest. With price now hovering around this zone again, the next move could be decisive for DOT's mid- to long-term trend.
---
🔍 Price Structure & Key Patterns
Extended Accumulation Phase: DOT has been trading in a sideways range for over 80 weeks, indicating a potential bottoming structure forming after a prolonged downtrend.
Strong Historical Demand: The $4.00 – $3.55 region has acted as a key support multiple times since 2022, reinforcing its importance as a make-or-break zone.
Potential Trap Setup: Current price action could be forming either a bull trap or bear trap, depending on whether price rebounds or breaks down. Weekly candle confirmation will be key.
---
🟢 Bullish Scenario (Upside Reversal)
If price holds and prints a strong bullish candle (e.g., bullish engulfing or long-tailed hammer), expect the following upside targets:
Short-term: $4.75 – $5.88
Mid-term: $7.63 – $9.00
Long-term: $10.37 – $12.49, aligning with prior distribution zones
✅ A breakout from this long accumulation base could trigger a massive short squeeze and renewed buying momentum.
---
🔴 Bearish Scenario (Breakdown)
If DOT closes below $3.55 on the weekly chart:
Confirms breakdown from macro support
Opens downside risk toward $2.30 – $2.00
Would print a new lower low, extending the bear market phase and potentially triggering capitulation
⚠️ Speculative long positions should include tight risk management below $3.50.
---
🧠 Market Sentiment & Strategy
DOT appears to be in a "Capitulation meets Hope" phase—selling pressure is exhausting, but bullish conviction hasn't yet taken control.
Ideal entry zones lie within the current demand range, with tight stops.
Watch for a daily breakout or bullish momentum confirmation next week before committing to positions.
---
📌 Final Takeaway
> DOT is standing at the edge of a cliff—or a launchpad. The $3.55–$4.00 zone has repeatedly been the foundation for rebounds. If history repeats, this may be the beginning of a new uptrend. If not—brace for deeper downside.
⏳ The market is watching. Will DOT break out… or break down?
#DOTUSDT #Polkadot #CryptoTechnicalAnalysis #SupportResistance #CryptoRebound #BearishOrBullish #AltcoinOutlook #CryptoBreakdown #WeeklyChart #AccumulationZone #DOTAnalysis
DOT/USDT Profit Heist | Don’t Let Bears Catch You🚨Polkadot Crypto Vault Break-In Plan | DOT/USDT Robbery Blueprint🚨
🌍 Hola Heist Crew! 💰📡
Ready for another vault-cracking strategy? Here's your DOT/USDT Crypto Heist Plan based on pure Thief Trading Style™—a fusion of smart-money tactics, technical traps, and stealth execution. 🎯💸
🔓 🎯 Entry Zone – Lockpick Ready
"The vault’s wide open! Swipe the bullish loot anywhere, anytime—but smart thieves plan pullback entries."
📌 Recommended: Use 15–30 min timeframe for sniper buys near swing highs/lows.
💡 Pro Move: DCA with layered buy limits like a seasoned thief stacking getaway routes. 🧠💵
🚔 Stop Loss – Evade the Patrol
📍 Secure SL just below the nearest 4H candle wick low (e.g., 4.000 zone)
🔐 Customize SL to match your risk profile & lot size—escape routes vary by thief rank.
💣 Target – Break the Vault & Vanish
🎯 TP: 5.200
🕶️ Optional: Dip out early if market heat rises near resistance traps. Escape clean.
⚠️ High Alert – Police Checkpoint Ahead
👮 Red MA Zone = Barricade.
It’s a hotspot for bearish cops + consolidation traps.
Only strong thieves survive here—book profits before you get cornered.
💼 For Scalpers & Swing Agents
🔍 Scalpers: Only ride long—quick bags, quick exit.
💰 Swingers: Follow the full robbery plan. Patience pays.
🎯 Trailing SL is your body armor—keep it tight.
📊 Fundamental Force Behind the Break-In
🔥 DOT/USDT is flashing bullish momentum supported by:
Sentiment shift
Intermarket alignment
COT positioning
On-chain data
📡 Stay updated via macro reports & sentiment dashboards—intel is profit.
📰 News Alert – Chaos Creates Opportunity
🧨 Avoid fresh entries during high-volatility news drops.
🎯 Trailing SL can save you during headline crossfire.
❗️Disclaimer:
This blueprint is for educational purposes only. Always conduct your own recon and apply strict risk management. Thieves who don’t scout first... get caught.
🚀 Boost the Heist – Support the Crew
💥 Smash that “Boost” if this plan adds value 💥
Your boost fuels more chart crimes, more profit hits, and a growing rob-the-market brotherhood! 💪💼📈
🧨 See you in the next job... Stay hidden, stay funded!
– Thief Trading Style™ HQ 🕶️🐱👤💰🚁

DOT | Bounce Setup from Major Support ZonePolkadot (DOT) has dropped sharply in recent weeks and is now testing a significant support zone between $3.60 – $3.70. This level has historically provided strong demand, making it a potential launch point for a bounce toward higher resistance levels.
Trade Setup:
🔹 Entry Zone: $3.60 – $3.70
🔹 Take Profit Zones:
• TP1: $4.30 – $4.70
• TP2: $5.20 – $5.60
🔹 Stop Loss: Below $3.30
DOT Predictions DOT Bullish DOT DOT DOT DOT Bullish DOT DOT DOT DOT Bullish DOT DOT DOT DOT Bullish DOT DOT DOTDOT Bullish DOT DOT DOTDOT Bullish DOT DOT DOTDOT Bullish DOT DOT DOTDOT Bullish DOT DOT DOTDOT Bullish DOT DOT DOTDOT Bullish DOT DOT DOTDOT Bullish DOT DOT DOTDOT Bullish DOT DOT DOTDOT Bullish DOT DOT DOTDOT Bullish DOT DOT DOTDOT Bullish DOT DOT DOTDOT Bullish DOT DOT DOTDOT Bullish DOT DOT DOTDOT Bullish DOT DOT DOTDOT Bullish DOT DOT DOTDOT Bullish DOT DOT DOTDOT Bullish DOT DOT DOTDOT Bullish DOT DOT DOTDOT Bullish DOT DOT DOT
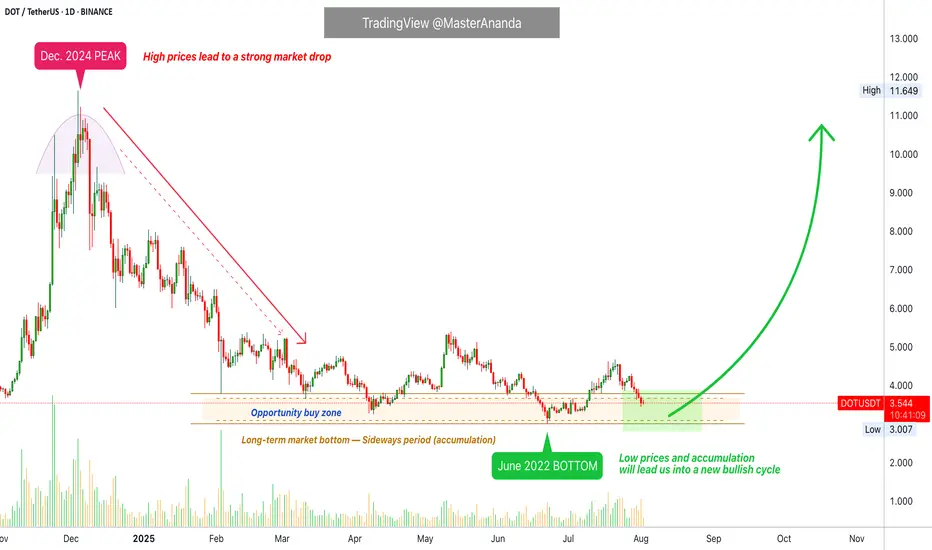
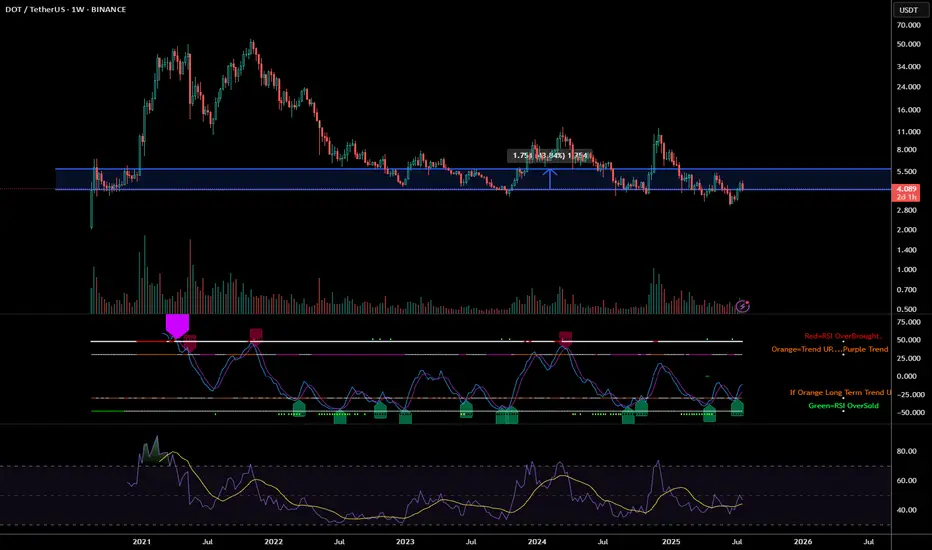
Polkadot · Trading at Bottom Prices · Bullish Scenario ExplainedThe same levels, the same prices, the same support zone. Polkadot is still trading at bottom prices. From the bottom the market tends to grow.
Good morning my fellow Cryptocurrency trader, I hope you are having a wonderful day. Notice the brown lines on the chart. We have the 7-April low, the June 22 low and also the low in March and yesterday, 1 August. This is a bottom range and this is the buy zone.
Polkadot (DOTUSDT) has been trading near this range since February 2025, six months ago. This is a very long—and strong—consolidation period. This much accumulation is surely the preparation for a major market change, a change of trend. A new uptrend. An event that has not happened since 2021.
I think the most important part is to truly understand that a bullish wave develops only from low prices. Notice the peak from December 2024. As soon as prices are high, the market seeks balance and starts to decline. But, when prices are low, an accumulation period develops and afterward a wave of growth. That is what I see happening right now across the market and with this chart. It already happened to hundreds of projects, literally. They all had the same chart.
These projects grew in late 2024, November-December. Then they went into correction in early 2025 until recently. The current low as witnessed on DOTUSDT led to massive growth. Some of these pairs are trading at new all-time highs while others have grown 500% or more. Those trading at the bottom are still early and next in line to move when the market does.
We will be bullish within days, as soon as Bitcoin ends its retrace. I shared in another publication why I believe Bitcoin will recover in the coming days.
Thank you for reading.
Namaste.
DOT Approaches Key Confluence Zone on Weekly and Daily Charts📅 CRYPTOCAP:DOT is at a crucial juncture, with major structure overlap across timeframes.
On the Weekly, price is testing support from a descending triangle 🛡️ — a level that has held multiple times in the past.
📆 Meanwhile, the Daily chart shows a falling wedge pattern forming 📐, a classic setup known for bullish reversals.
The confluence here adds weight — this is a zone where price often reacts.
👀 Bounce incoming or breakdown loading? This one deserves close attention.
What’s your take on the next move?
Not financial advice. BINANCE:DOTUSDT
DOT is sitting at the bottom of the Weekly Channel💰 #DOT is sitting at the bottom of the Weekly Channel👀
Given the fact that market is in correction mode, it's literally the dip🔥
Target: 10$📈
DOTUSDTThe first higher high after a downtrend indicates a potential trend reversal to the upside. It shows that buyers are starting to regain control, signaling the possibility of a new bullish trend.
Trendline Break: A break above a significant trendline further confirms the shift in sentiment from bearish to bullish. The trendline break signifies that selling pressure has weakened, and the market is poised for further upward movement.

Dot/usdtPolkadot (DOT) cryptocurrency is showing potential for growth from around the $3.40 level.
If the price moves upward, it could potentially reach $5.20, $8, and even $12.
This analysis remains valid as long as the support level at $3.10 holds and no lower low is formed.
Please note: This analysis involves risk. Make sure to apply proper risk management.

Price floor: The opportunity to buy has arrived.Hello friends🙌
According to the decline we had, you can see that the price has reached its historical low, which has given good profits whenever it reaches this low. Now, with capital and risk management, we can buy within the limits of the low and move with it to the specified targets.
🔥Follow us for more signals🔥
*Trade safely with us*

Polkadot (DOT): Strong Signs of Potential Bullish MovementPolkadot caught our attention with rather good potential for upward movement from here, which can be seen both on 30M timeframe and 4H timeframe
More in-depth info is in the video—enjoy!
Swallow Academy

DOT It will grow soon...The DOT will increase $1 and reach to the top of the wedge in the coming weeks .
Best regards CobraVanguard.💚

Polkadot (DOT) Technical Analysis: Navigating the Path Forward Polkadot (DOT) is currently trading at approximately $4.08 (as of July 25, 2025), having experienced significant volatility in recent months. After reaching a local high of $7.64 in mid-April 2025, DOT has undergone a substantial correction, losing approximately 46% of its value. This analysis examines DOT's technical position and potential trajectory for the remainder of 2025.
Price Structure Analysis
The daily chart reveals DOT has been in a defined downtrend since April 2025, characterized by a series of lower highs and lower lows. Most recently, price has established a trading range between $3.90-$4.30, suggesting potential stabilization after the steep decline. This consolidation zone represents a critical juncture for DOT's next directional move.
Key observations from the price structure:
Descending Channel Formation: DOT has been trading within a descending channel since April, with the upper boundary currently around $4.50 and lower boundary near $3.80.
Support Cluster: Multiple support tests in the $3.90-$4.00 region have held thus far, potentially forming a base for a recovery attempt.
Volume Profile: Trading volume has been notably higher during recent consolidation compared to previous months, suggesting increased interest at these price levels.
RSI Analysis: Signs of Potential Reversal
The Relative Strength Index (RSI) provides compelling evidence for a potential trend shift:
Bullish Divergence: While price made lower lows in late June and early July, the RSI formed higher lows, creating a bullish divergence pattern that often precedes reversals.
Oversold Recovery: The RSI reached oversold territory (below 30) in mid-June and has since recovered to the 40-45 range, indicating diminishing selling pressure.
RSI-based MA Crossover: The RSI has recently crossed above its moving average, a signal that has historically preceded price recoveries for DOT.
The 4-hour chart shows the RSI establishing a series of higher lows while price consolidates, suggesting building momentum beneath the surface despite sideways price action.
Support/Resistance Level Analysis
Critical price levels that will influence DOT's next directional move:
Support Zones:
Primary: $3.90-$4.00 (current consolidation floor)
Secondary: $3.60-$3.70 (previous support from May)
Tertiary: $3.30-$3.40 (major support from early 2025)
Resistance Zones:
Immediate: $4.30-$4.50 (upper boundary of current consolidation)
Major: $4.80-$5.00 (previous support turned resistance)
Structural: $5.70-$6.00 (descending trendline from April high)
Volume Analysis
Volume patterns provide additional context for DOT's current position:
Declining Sell Volume: Selling volume has progressively decreased during the recent consolidation phase, suggesting exhaustion of selling pressure.
Volume Spikes on Bounces: Recent upward price movements have been accompanied by above-average volume, indicating potential accumulation.
Volume Contraction: The overall contraction in trading volume during the recent range-bound price action typically precedes significant moves.
Market Structure Analysis
Examining DOT's market structure reveals several important patterns:
Potential Inverse Head & Shoulders: The recent price action is forming what could develop into an inverse head and shoulders pattern, with the neckline around $4.50. Completion of this pattern would project a move toward $5.20-$5.40.
Wyckoff Accumulation: The price action since mid-June displays characteristics consistent with Wyckoff accumulation, including:
Spring phase (drop to $3.59 in late June)
Test phase (retest of lows in early July)
Sign of strength (move toward $4.20 on increased volume)
Compression Pattern: Price volatility has been decreasing, forming a compression pattern that typically resolves in a strong directional move.
Moving Average Analysis
Moving averages confirm DOT's bearish positioning but show early signs of potential trend change:
Below Key MAs: DOT remains below all major moving averages (50, 100, and 200-day), confirming the bearish trend.
MA Compression: The gap between shorter and longer-term moving averages is narrowing, often a precursor to trend shifts.
RSI-based MA Crossover: While price MAs remain bearish, the RSI-based moving average has turned upward, often an early indicator of trend reversal.
Fibonacci Retracement Analysis
Using the move from the April high ($7.64) to the June low ($3.59):
23.6% Retracement: $4.54 (immediate target on breakout)
38.2% Retracement: $5.13 (medium-term target)
50% Retracement: $5.62 (significant resistance level)
61.8% Retracement: $6.10 (major resistance level)
The current price action suggests DOT is attempting to establish a base before potentially targeting these retracement levels.
Scenario Analysis
Bullish Scenario
If DOT can decisively break above the $4.50 resistance level with increased volume:
Initial Target: $4.80-$5.00 (previous support turned resistance)
Secondary Target: $5.50-$5.70 (50% retracement level)
Extended Target: $6.00-$6.30 (61.8% retracement and structural resistance)
Catalysts: Successful parachain upgrades, increased developer activity, or broader crypto market recovery could drive this scenario.
Bearish Scenario
If DOT breaks below the $3.90 support level:
Initial Target: $3.60-$3.70 (previous support)
Secondary Target: $3.30-$3.40 (major support level)
Extended Target: $3.00 (psychological support)
Catalysts: Continued weakness in the broader crypto market, technical issues with the Polkadot network, or regulatory concerns could trigger this scenario.
Most Probable Scenario
Based on the weight of technical evidence, the most probable scenario appears to be:
Continued consolidation between $3.90-$4.50 for the next 1-2 weeks
Eventual breakout above $4.50 targeting the $5.00 level
Establishment of a new trading range between $4.50-$5.50 through August-September
This scenario is supported by the bullish divergences, decreasing selling volume, and early signs of accumulation.
Trading Strategy Recommendations
For Long-Term Investors
Accumulation Strategy: Consider dollar-cost averaging in the current $3.90-$4.20 range
Position Sizing: Maintain appropriate position sizing given DOT's high volatility
Key Levels: Use the $3.60 level as a stop-loss for new positions
For Active Traders
Range-Bound Strategy: Trade the current range between $3.90-$4.30 until a breakout occurs
Breakout Strategy: Enter on confirmation of breakout above $4.50 with targets at $4.80, $5.20, and $5.70
Risk Management: Maintain tight stops below $4.30 on breakout trades to protect against false breakouts
For Risk-Averse Investors
Confirmation Approach: Wait for confirmation of trend reversal (price above $4.80 and 50-day MA)
Partial Position: Consider establishing partial positions at current levels with defined risk parameters
Technical Triggers: Look for RSI moves above 60 as confirmation of momentum shift
Conclusion: Cautious Optimism for DOT
The technical picture for Polkadot suggests we may be approaching an inflection point after the substantial correction from April highs. Multiple technical indicators point to diminishing selling pressure and early signs of accumulation, creating the conditions for a potential recovery.
While DOT remains in a technical downtrend, the convergence of bullish divergences, volume patterns, and market structure suggests the potential for a trend reversal in the coming weeks. The $4.50 level represents the key technical hurdle that must be overcome to confirm this shift.
For investors and traders, a balanced approach is warranted—acknowledging the current bearish trend while positioning for a potential reversal. The risk-reward profile appears increasingly favorable for cautious accumulation at current levels, with clearly defined risk parameters.
The most probable path forward appears to be continued consolidation followed by a gradual recovery toward the $5.00-$5.50 range by late Q3 2025, contingent upon broader market conditions and continued development progress within the Polkadot ecosystem.

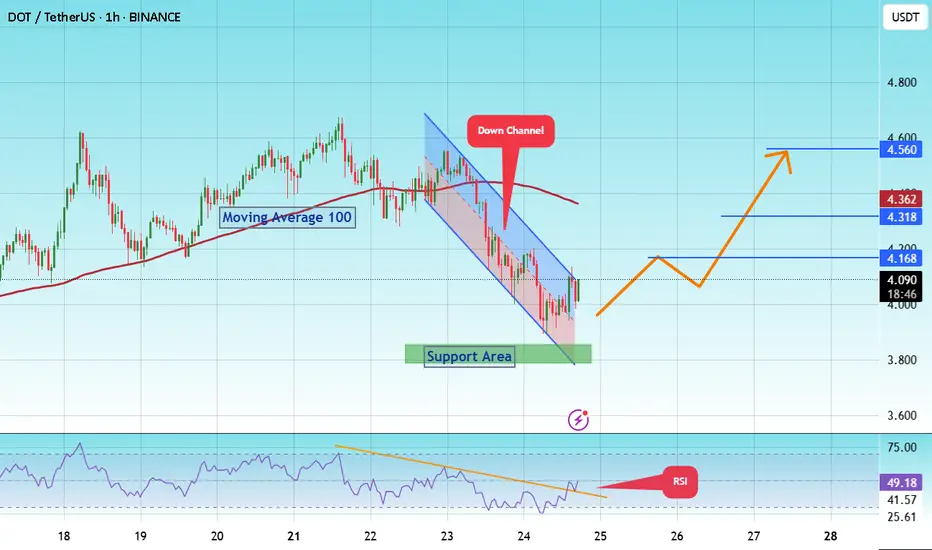
#DOT/Eyes 15% Rally, Targeting Key $ 4.560 Resistance Level#DOT
The price is moving within a descending channel on the 1-hour frame and is expected to break and continue upward.
We have a trend to stabilize above the 100 moving average once again.
We have a downtrend on the RSI indicator that supports the upward break.
We have a support area at the lower limit of the channel at 3,870, acting as strong support from which the price can rebound.
We have a major support area in green that pushed the price higher at 3,800.
Entry price: 4.084
First target: 4.168
Second target: 4.318
Third target: 4.560
To manage risk, don't forget stop loss and capital management.
When you reach the first target, save some profits and then change your stop order to an entry order.
For inquiries, please comment.
Thank you.
DOT – Structure Aligning Across Multiple TimeframesCRYPTOCAP:DOT is quietly setting up an interesting technical structure across different timeframes 📊.
On the 2-hour chart, price is gliding inside an ascending parallel channel, respecting both the upper and lower trendlines 📈. This clean structure often leads to smooth momentum-driven moves.
Zooming out to the daily timeframe, CRYPTOCAP:DOT is reclaiming a key support-resistance zone 🟢. This could indicate that bullish momentum is quietly building beneath the surface.
Traders should stay attentive—when multiple timeframes align, the probability of a decisive move increases 🚀.
DOT Bullish Outlook: $6.5, $9, and $12.5 AheadHello✌
Let’s analyze Polkadot’s upcoming price potential 📈.
BINANCE:DOTUSDT , I expect a long-term upward trend.
This analysis includes three main targets: $6.5, $9, and a final target of $12.5, which could be reached within 2 to 6 years.
Strong daily resistance and support levels are clearly marked on the chart, showing that the price is following a healthy and reliable path.
✨We put love into every post!
Your support inspires us 💛 Drop a comment we’d love to hear from you! Thanks , Mad Whale🐋
🐋Many of the points and levels shown on the chart are based on personal experience, feeling, and over 7 years of research and daily study of crypto charts.
Some of the lines, channels, and price zones are drawn to make the chart easier to understand and to help imagine possible future price movements.
I’ve also included one very big drop in price even bigger than the others because in the crypto market, it’s common for prices to suddenly fall hard and push out small investors and traders with positions.
The targets on the chart are not guaranteed; they might be reached, or they might not.📚
📜Please make sure to do your own research before investing, and review the disclaimer provided at the end of each post.

Polkadot (DOT): Looking For Another 15% Bullish MovementSeeing good potential for another 15% movement where we are about to form a proper BOS on the 30M timeframe, but there is that bearish CME gap that we also keep an eye on!
More in-depth info is in the video—enjoy!
Swallow Academy
