Last Shakeout Has Happened For PolkaDot DOTHello, Skyrexians!
We have seen many negative reactions on our recent analysis on XRP where we pointed out that it it in the distribution zone. We don't understand the sense t hold such overbought asset. Even if growth continues the potential is very low. It's much better to take a look at assets which are still at the bottom, like $BINANCE:DOTUSDT.
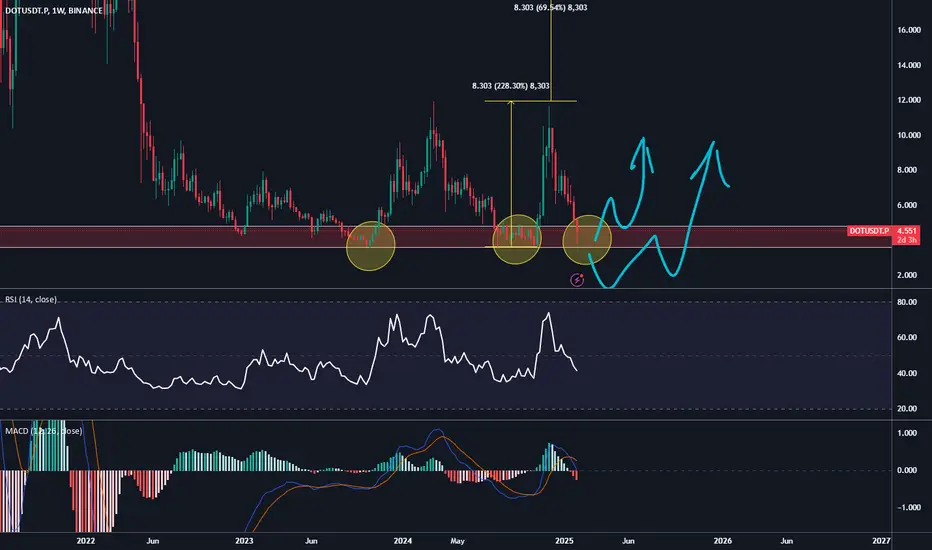
On the weekly time frame we can see that DOT tested the support level again and formed the confirmed green dot on the Bullish/Bearish Reversal Bar Indicator . This is the strong signal for the corrective global wave 2 finish. The next target is 1.61 Fibonacci extension at $88 at least. The maximal target is much higher at 2.61.
Best regards,
Skyrexio Team
___________________________________________________________
Please, boost this article and subscribe our page if you like analysis!
DOTUST trade ideas

DOTUSDT SLIGHT BULISH"After a few days, I can see a bullish movement in DOTUSDT for the short term.
This analysis is based on recent candles, and the targets are close together, making them achievable in the short term.
Note: Please pay close attention to the danger zone and stop loss levels to manage your positions effectively.
Note: My ideas are not intended for any type of scalping or scalpers!
You can find the full list of my ideas here: www.tradingview.com
Here are some of my ideas:

DOT Holding Strong – A Rally to $11 Incoming?DOT has been consolidating within a well-defined range between support zone Green a $3.499 - $3.852 and the resistance zone Blue at $10.203 - $11.090 for an extended period. Recently, the price rebounded from the lower boundary of this range, signaling potential upward momentum. If bullish strength persists, in the coming days, DOT is expected to move toward the upper resistance marked in Blue, provided the bullish momentum continues.

dotusdtdot may come and fill fvg before one more high at least and then back to the lows . never trade without sl .

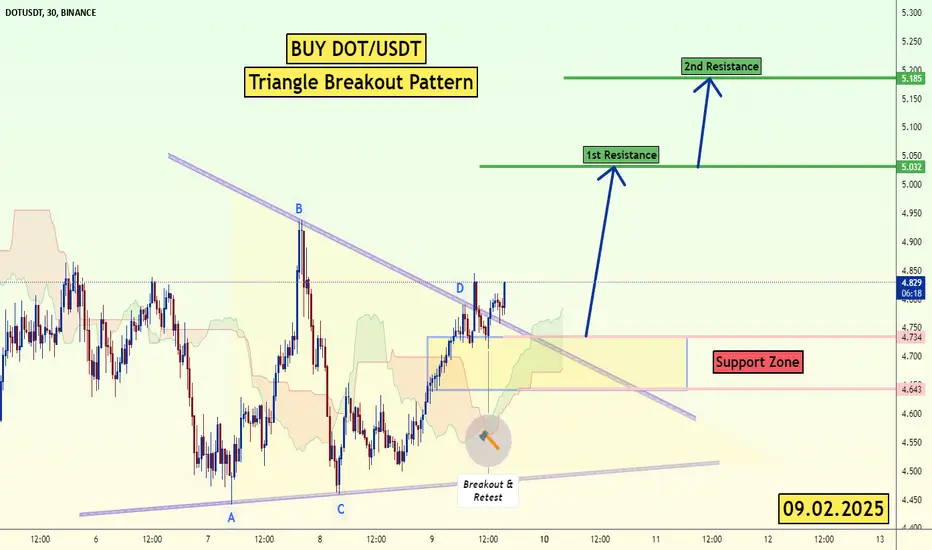
DOT/USDT Triangle Breakout (9.02.25)The DOT/USDT pair on the M30 timeframe presents a Potential Buying Opportunity due to a recent Formation of a Triangle Breakout Pattern. This suggests a shift in momentum towards the upside and a higher likelihood of further advances in the coming hours.
Possible Long Trade:
Entry: Consider Entering A Long Position around Trendline Of The Pattern.
Target Levels:
1st Resistance – 5.03
2nd Resistance – 5.18
🎁 Please hit the like button and
🎁 Leave a comment to support for My Post !
Your likes and comments are incredibly motivating and will encourage me to share more analysis with you.
Best Regards, KABHI_TA_TRADING
Thank you.
Be careful with DOT !!!The price has formed a bullish wedge on the 1h time frame, and if it breaks out, it can drive the price up to around $5.
Give me some energy !!
✨We spend hours finding potential opportunities and writing useful ideas, we would be happy if you support us.
Best regards CobraVanguard.💚
_ _ _ _ __ _ _ _ _ _ _ _ _ _ _ _ _ _ _ _ _ _ _ _ _ _ _ _ _ _ _ _
✅Thank you, and for more ideas, hit ❤️Like❤️ and 🌟Follow🌟!
⚠️Things can change...
The markets are always changing and even with all these signals, the market changes tend to be strong and fast!!

Will Dot break the barrier of the inheritance channel?Hello everyone, let's look at the 1D Dot chart to USDT, in this situation we can see how the price moves in a local strong tendu inheritance channel.
However, let's start by defining goals for the near future the price must face:
T1 = = $ 5.31
T2 = = $ 6.14
Т3 = 6.70 $.
T4 = $ 7.63
Let's go to Stop-Loss now in case of further declines on the market:
SL1 = $ 4.47
However, we still have a very strong support zone that has repeatedly maintained the price from a further correction zone from $ 3.95 to $ 3.56.

Polkadot (DOT): Looking For Another 25-30% Drop / Be Careful!Polkadot has been trading inside a sideways channel where we had a decent rejection from the resistance zone and now price has fallen below the branch of EMAs.
We are looking now for another 25-30% decline to happen here as long as sellers maintain the dominance below the EMAs like they did after a similar situation on the 11th of April!
Swallow Team


DOT USDT💰 #DOT
CRYPTOCAP:DOT Polkadot is approaching a major support zone within a falling wedge pattern 🔍
If support holds, expecting a bounce towards $7.988, $10.060, and $12.327 🎯

Polkadot (DOT): Plan A Being Executed!!! Looking For MSBSince last time we had 3 different scenarios for the coin where "Plan A" took the lead and sellers are slowly taking over zone by zone.
Currently, after the dominance near the resistance zone, we are looking now for a smaller MSB to form, which then would send price to even lower zones so let's see how we end up here!
Swallow Team

DOT/USDT Weekly Analysis🔹 Key Resistance & Spot Trigger:
The chart indicates a major resistance level around $10.465, where the price previously faced rejection. This zone acted as a spot trigger, leading to a sharp decline in price.
🔹 Price Action & Trend:
After the rejection at the resistance, the price dropped significantly, aligning with the downward movement of the orange moving average. Currently, the market is testing a key support zone between $3.90 - $4.50.
🔹 Volume Analysis & Sales Pressure:
The increase in sales volume suggests that sellers are still in control. However, if the price finds strong support in the highlighted box, we may see a potential reversal or accumulation phase.
🔹 Future Outlook:
📉 If the support fails, further downside towards lower historical levels is possible.
📈 If buyers step in, a recovery towards the $6 - $7 resistance zone could be expected.
💡 Trading Plan: Watch for bullish signals within the support area before entering a position. Confirmation via volume and candlestick patterns will be crucial.

We are so close!I love Polkadot and community of this coin. We all know BINANCE:DOTUSDT made huge impulse about a year ago and still consolidating around it. Checking 4.5 area is crucial for BINANCE:DOTUSDT , because that means it is triple bottom which is a huge reversal pattern. If we ever see candle below 3.5 that is the point we consider Long-term long position in either Spot or Futures. Also MACD and RSI making divergence in 1W timeframe.
I will be taking profits at 20, 24, 32, 55 ( ATH ).
TradeCityPro | DOTUSDT Weekly Range Boxes of Altcoins👋 Welcome to the TradeCityPro channel!
Let’s analyze DOT, one of the popular cryptocurrencies, and identify its potential entry points.
🌐 Overview Bitcoin
Before diving into the DOT analysis, let's check Bitcoin on the one-hour timeframe. Due to today's NFP news, Bitcoin has experienced volatility and once again got rejected from the critical $100,000 psychological resistance.
This rejection has led to selling pressure, pushing Bitcoin back toward the 96,445 support, which now has a higher probability of breaking due to this rejection. Additionally, Bitcoin dominance remains within the defined range, showing a slight upward bias.
If we see a correction, altcoins are likely to experience further declines, and I don't expect any major movements until the end of the week.
🕵️♂️ Previous Analysis
In our previous DOT analysis, we expected a decline after breaking $6.554, leading to a test of the daily range high. However, recent market conditions caused DOT to wick down as low as $3.743, which is its strongest support level.
📊 Weekly Timeframe
DOT remains inside its weekly range, and despite its 170% range, it is still considered ranging rather than trending.
I've previously discussed "money traps", and this applies here too. You can buy at $3.719, but without momentum, your capital could remain stuck in this asset for a long time. Who knows—could DOT be the next LUNA?
Considering these factors, I prefer either a strong reaction at $3.719 or a breakout above $10.309 before entering a position. I’d rather focus on coins that confirm a breakout before entering**, like Jasmy, which recently provided a 400% gain.
For exiting, if $3.719 support breaks, it's better to accept the loss and exit. Later, if a buy signal reappears, you can re-enter using the same USDT amount, instead of holding and losing more DOT.
📈 Daily Timeframe
On the daily timeframe, DOT faced a strong rejection at $10.725, forming consecutive lower highs and lower lows. However, recent selling pressure appears to be weakening, and we are currently sitting on the $4.626 support.
Additionally, a trendline is forming, and if DOT rejects from it in the future, this would indicate continued bearish momentum, providing an opportunity to keep short positions open from higher levels.
I personally believe DOT may enter a range for some time, allowing traders who made emotional decisions due to FOMO and market volatility to reassess. For now, I expect the $3.719 support to hold.
That doesn’t mean we should buy immediately. Our strategy is clear , buy after a breakout above $10.725 , Wait for an accumulation range to form or Look for a sharp upward move, retest a key trigger level, and confirm a breakout before entering.

DOT: Trading in a Range – What’s Next?The chart shows that Polkadot (DOT) has been trading within a defined range between $3.76 – $11.34 for a long time.
🔻 Resistance Level: ~$11.34 – the price has bounced off this level multiple times.
🟢 Support Level: ~$3.76 – a historically strong zone where demand appears.
📊 What Could Happen Next?
DOT is currently testing the support zone again. If it holds, we might see a rebound towards $11.34. Otherwise, a breakdown below this level is possible.
⚠️ Strategy:
1️⃣ Monitor the price reaction in the $3.76 – $4.85 zone.
2️⃣ If a rebound is confirmed, the potential upside target is $11.34.
3️⃣ If support fails, a deeper correction could follow.

Polkadot (DOT): Easy Step by Step (just like last time)Polkadot seems to form a similar pattern on a bigger timeframe where, after seeing another rejection from the upper resistance zone, we are expecting the price to fall even lower (one last drop) before heading for another sharp bullish movement.
But before the last fall we need to see some kind of sideways movement so from here (the EMAs) we expect to see some kind of bullish movement so let's see how all this plays out!
Swallow Team

Polkadot (DOT): Possible Zone of Rejections / Plan A & Plan BPolkadot has bounced recently from EMAs where price is sitting slightly below the resistance zone.
We are waiting for more clarity here but overall we came out with Plan A and Plan B.
I think everyone understands the moves behind Plan A and B so nothing much to say here; rather, for now we have to wait and see who will take the dominance and control over the current resistance zone!
Swallow Team

My Insight on DOT came True! what's next?BINANCE:DOTUSDT
as I expected, Dot reached the support level I mentioned before!
Now I expect it ascend from here and reach around 6.3!
⚠️ Disclaimer:
This is not financial advice. Always manage your risks and trade responsibly.
👉 Follow me for daily updates,
💬 Comment and like to share your thoughts,
📌 And check the link in my bio for even more resources!
Let’s navigate the markets together—join the journey today! 💹✨

long term DOT forecast based on ETH patternPolkadot will update its ATH, but the time targets may be different

#DOT/USDT#DOT
The price is moving in a descending channel on the 1-hour frame and is adhering to it well and is heading to break it upwards strongly
We have a bounce from the lower limit of the descending channel, this support is at a price of 4.10
We have a downtrend on the RSI indicator that is about to be broken, which supports the rise
We have a trend to stabilize above the moving average 100
Entry price 4.60
First target 5.40
Second target 6.02
Third target 6.80

DOTUSDT Long Trade Setup📊 Price Action & Trend Analysis
Analyzing market trends using price action, key support/resistance levels, and candlestick patterns to identify high-probability trade setups.
Always follow the trend and manage risk wisely!
Price Action Analysis Interprets Market Movements Using Patterns And Trends On Price Charts.
👉👉👉Follow us for Live Market Views/Trades/Analysis/News Updates.

DOTUSDT 1WDOT ~ 1W Analysis
#DOT This is the lowest support for now. Buy from here if you still have a Conviction on this coin with a minimum target of 20%+

DOT/USDTWave 2 of 3 complete, get ready for wave 3 of 3. Altcoin season is closer than your jugular vein.
