DOT - Get Ready!Dear my friends,
This year, the market feels strange. BTC keeps soaring while altcoins keep dropping. Do you sense the irrationality in play? Take a closer look at DOT. A significant volume spike has appeared, reminiscent of the conditions during the price surge in 2021. The time interval from this volume breakout to the subsequent rapid price increase is also strikingly similar. Observe the Ichimoku cloud—it has entered the cloud twist phase. I believe the price surge is merely delayed. Let’s prepare for DOT’s spectacular move. BNB and XRP have already broken their previous highs. Now it’s the turn of other major coins like DOT, LTC, and SXP. Coins that have broken their previous highs may still have room to rise further. However, at this moment, I’m focusing on coins with strong positioning, waiting for their breakout.
Best Regards,
DOTUST trade ideas

SPOT DOT LONG 20.01.2025Pinning after exhaustion of sales.
🎯Purpose:
10.338
I'll let you know when I record it manually.
‼️Risk per trade: 1% of the allocated funds for spot trading.
Thank you for follow and the reaction🚀.

DOT LongIf you wanted to size up DOT with clear exit points, there is an easy and clear trading plan.
Bullish Divergence
Backtesting Support
Breakout of a Bullish Dragon on the 1D & lower tf
Bullish Candlestick Pattern
Holding the 0.618 as support

#DOT/USDT breaks the Diagonal Trendline on the Daily TF!#DOT/USDT breaks the Diagonal Trendline on the Daily TF!
💡 Plan: Waiting for a Daily FVG tap to consider a long position on $DOT.
🔑 Key Levels:
Resistance: PMH $11.66
Support: PML $6.044

DOT Poised for a Breakout: Key Levels and Price Recovery OutlookHello, Traders!
After reaching its highest point since last March, DOT price entered a correction phase, dropping over 40% from its recent peak.
However, it's showing signs of recovery and is currently trading above the $7 price level.
At this stage, it's highly probable that DOT has established a local bottom at the $6 level, making it unlikely that the price will drop below this support area under current market conditions.
Looking ahead, there are two key resistance levels to monitor at $8 and $9.
Breaking through these levels could open the door for a significant rally, with the potential to push DOT above the $12 mark — a price point not seen since 2022.
From a mid-term perspective, DOT continues to exhibit bullish tendencies, supported by improving market sentiment and increasing interest in the broader Polkadot ecosystem.
As development activity and adoption grow, it's only a matter of time before the price begins to climb again.
Please don’t forget to boost this idea and leave your comments below.

DOTUSDT 1WDOT Update ~ 1W
#DOT Still maintaining its bullish structure. This is wave 2. buy in stages from here. With a minimum target of 20%++. Wave 3 is the longest wave in the Eliot Wave pattern.
Polkadot (DOT/USDT) The price is currently in the upper part of the ascending channel, indicating strong bullish momentum.
A breakout above the green resistance zone could signal a move toward higher levels, likely beyond $8.50.
If the price fails to break through the green zone, a pullback to the channel's lower boundary or the yellow support zone is possible.

DOTUSDT Spot Trade setupDOTUSDT long setup for Higher time frame... BTC showing bullish signs, and all lows swept perfectly following the levels on HTF

"DOT/USDT: Bullish Divergence Spotted on 4H Chart with Trend BreDOT/USDT has shown a bullish divergence on the 4-hour chart, indicating potential upward momentum. Additionally, the price has broken out of its previous trend, confirming a shift towards a bullish trajectory. This could signal further upside potential for traders/

Will #DOT Break Free or Get Caught in a Bearish Trap? Key LevelsYello, Paradisers! #DOTUSDT is gearing up for a major move, but will it be a breakout to new highs or a collapse to lower levels? Let’s dive into the current setup of #Polkadot:
💎#DOT is trading within a falling wedge formation, a classic bullish reversal pattern often seen before significant price surges. Over the last few weeks, we’ve seen multiple liquidity sweeps at lower levels, where impatient traders got shaken out. These sweeps usually hint at a potential breakout, but confirmation is still key before making any decisive moves.
💎#DOTUSD faces strong resistance near $8.00, which aligns with the upper boundary of the falling wedge. For bulls to take control, the price must close above this level on the 8-hour timeframe. A breakout here could trigger a powerful rally toward the $11.00–$11.5 major resistance zone, where sellers are likely to step in.
💎The first significant support level sits at $6.41, an area where buyers have consistently entered the market. If this zone holds, it could serve as a springboard for the next upward move. If #Polkadot closes below $6.41, the next major support lies between $5.80–$5.34.
💎A close below $5.34 would signal a breakdown of bullish momentum, increasing the likelihood of a prolonged bearish phase. The bears will take control of the price movement and it will fall to lower support levels.
Stay focused, patient, and disciplined, Paradisers🥂
MyCryptoParadise
iFeel the success🌴

Polkadot Complete is Retracment Polkadot Complete is Retracement and start and break its bearish trendline and retest also on 4hr Tf i mark a bullish entry and make proper plan.

DOT - bullish pattern Hello, fellow traders!
DOT is looking promising on the daily timeframe. We've got a bullish wedge pattern forming beautifully, with a solid bounce off a strong support level (0.61 Fib)
safest entry is to wait for the breakout.
Targets? They're clearly marked on the chart for you to aim for.
As for your stop loss, the choice is yours:
Place it below the green support zone, or better
Tuck it under the lower trendline of the wedge.
Just make sure it’s based on a daily candle close.
Good luck, and may the profits roll in! 🚀
COINBASE:DOTUSD BINANCE:DOTUSD BINANCE:DOTUSDT BINANCE:DOTUSDT.P KUCOIN:DOTUSDT BINANCE:BTCUSDT

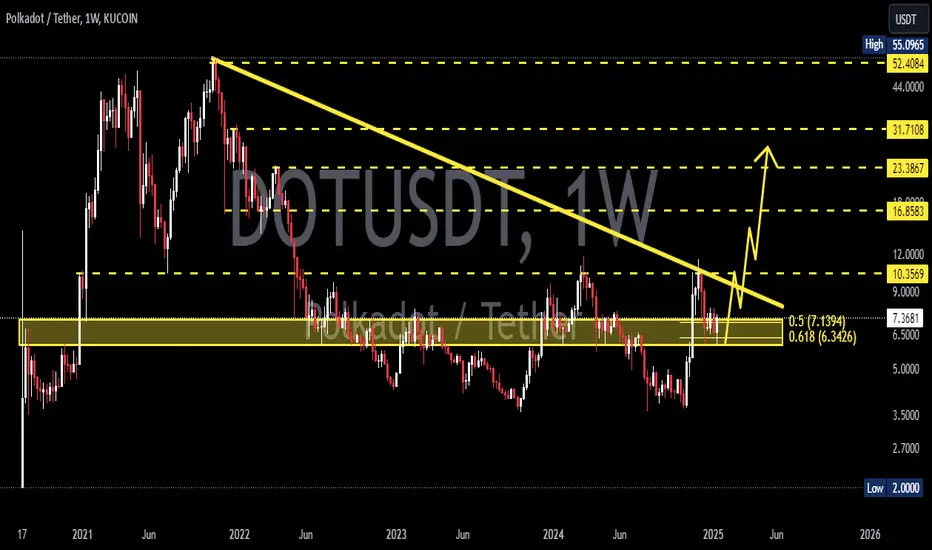
DOT/USDT at Key Support: A Surge on the Horizon?DOT/USDT is currently trading at a crucial level, aligning with the golden Fibonacci 0.618 and a key support zone.
If USDT.D drops from its current levels, we could see a potential surge in DOT, supported by its strong fundamentals.

DOT - Ideas how to trade it. 12$ DOT is inevitable Sceanrio 1: trading the channel
Scenario 2: trading the key Support level below

Dot target 55$ is Loading...Dot Target why 55 $ ?
as We can see Dot confirmed First HL at HT also Long term accumulation that has not broken yet (almost 973 days..)
Dot also printed double bottom pattern so i think big bullish movie ahead
Hold your bag tightly
what do you think ?

DOT/USDT 1D chart reviewHello everyone, let's look at the 1D DOT to USDT chart, in this situation we can see how the price is moving in a local uptrend channel where the price is moving at its lower boundary.
Let's start, however, by defining the goals for the near future that the price must face:
T1 = $7
T2 = $7.35
T3 = $7.92
T4 = $8.86
Now let's move on to the stop-loss in case the market continues to decline:
SL1 = $6.47
SL2 = $6.24
SL3 = $5.86
SL4 = $5.58
Looking at the STOCH indicator, we can see that we are moving along the lower boundary, which may indicate an upcoming upward movement in price.


DOT's bearish movementBINANCE:DOTUSDT
DOT is going to decrease, cause we can see a bearish pattern(Inverse head and shoulder) pattern on it
I expect it to decrease to the shown support zone.
⚠️ Disclaimer:
This is not financial advice. Always manage your risks and trade responsibly.
👉 Follow me for daily updates,
💬 Comment and like to share your thoughts,
📌 And check the link in my bio for even more resources!
Let’s navigate the markets together—join the journey today! 💹✨

Trading opportunity for DOTUSDTBased on technical factors there is a Buy position in :
📊 DOTUSDT
🔵 Buy Now
🪫Stop loss 6.690
🔋Target 7.350
📏 R/R 3
💸RISK : 1%
We hope it is profitable for you ❤️
Please support our activity with your likes👍 and comments📝

Last Chance to Grab DOTUSDT before Explosion!Look for buy setups on these levels
5.8$
5.2$ (Strong Demand Zone)
4.5$
Keep in mind that 5.2$ is a very strong demand zone, and may never be broken. I'm expecting the price to hit this level with a shadow. Consider placing your orders now.
As for targets, my first TP would be 17$ , with the possibility of going much higher. Currently the trend is not powerful enough for a new ATH.

Polkadot is aiming for $20Polkadot is quite old and large asset with capitalisation already exceeding $10B. It is one of the few that has not yet shown significant growth like XRP, XLM and other old guys. It is quite difficult to move such an asset, but the target of around $20 is quite realistic. On the daily timeframe there is a consolidation above 50 EMA, we saw a test pump. The growth will start during these two months and then the distribution phase. The 0.5 and 0.618 levels are not bad options to fix your positions.
Horban Brothers.

DOT 1hr with TA by GrokAI
Given the chart provided and your interest in cryptocurrency trading, here's an in-depth technical analysis (TA) of the DOT/USDT chart:
Price Action & Trend:
The price is currently near a resistance level around 7,732 USDT. This level has been tested multiple times, indicating strong resistance.
There's a visible uptrend before hitting this resistance, suggesting bullish momentum leading up to this point.
Moving Averages (MA):
The 20-period SMA (Simple Moving Average) is above the 50-period SMA, which is typically a bullish sign, indicating short-term momentum is stronger than the long-term trend.
The price has crossed below the 20-period SMA, which might suggest a potential reversal or correction phase if the resistance at 7,732 holds.
Volume:
There's a noticeable increase in volume at the resistance level, which could indicate either a strong push to break through or a rejection at this price level.
Relative Strength Index (RSI):
The RSI is approaching overbought territory but hasn't crossed into it yet. This suggests that while the asset is gaining strength, it's not yet at a level where a significant pullback is imminent due to overbought conditions.
Chande Momentum Oscillator (CMO):
The CMO shows momentum is positive but has started to decline, which could be early signs of weakening bullish momentum.
Fibonacci Retracement:
If we consider the recent uptrend from the low around 7,112 to the high at 7,732, the Fibonacci levels could be:
23.6% at around 7,270
38.2% at around 7,380
50% at around 7,422 (which is also a psychological level)
61.8% at around 7,464
These levels could act as support if the price pulls back from the current resistance.
Support and Resistance:
Immediate support could be found around the 20-period SMA, which is currently around 7,700 and descending.
Stronger support might be around the 50-period SMA, which is lower, around 7,650.
Potential Scenarios:
Bullish Scenario: If the price breaks above the 7,732 resistance with strong volume, it could target the next psychological level around 7,800 or higher.
Bearish Scenario: If the price fails to break the resistance and volume decreases, we might see a correction towards the Fibonacci levels or the moving averages.
Given your interest in cryptocurrencies and previous posts about market movements, it's crucial to watch for confirmation of a breakout or breakdown. If you're looking to make a decision based on this chart:
For Long Positions: Consider waiting for a confirmed breakout above 7,732 with increased volume for a safer entry point.
For Short Positions: Look for a failure to break the resistance followed by a decrease in volume and price action confirming a move lower.
Always remember to use stop-loss orders to manage risk, especially in markets known for volatility like cryptocurrencies.

Analysis of DOT against TetherHello speculators.
Here is my contribution to the community. I am buying some DOT for the following reasons.
Reasons:
1 - Long-term uptrend.
2 - Break of important long-term support with pullback.
3 - Good risk/return ratio.
If you liked this analysis, leave your review and press the like button.
