dotIf we consider this move as a pullback, we can expect support from the green box, and if it breaks, the blue lines will be lower.
DOTUST trade ideas

DOTUSDT Elliott Waves AnalysisHello friends.
Please support my work by clicking the LIKE button👍(If you liked).
Everything on the chart.
Entry zone: market and lower
Targets: 15 - 25 - 35
after first target reached move ur stop to breakeven
Stop: (depending of ur risk).
ALWAYS follow ur RM
risk is justified
It's not financial advice.
DYOR!

PolkaDot DOT Has Just Flashed Insane Long Signal!Hello, Skyrexians!
Recently we made BINANCE:DOTUSDT analysis for you, where told you that huge pump ahead. There was a price at $5. After that price reached $11 and showed the significant correction. Now most of people are talking that DOT is scam and will reach $2, but we have other opinion.
Let's take a look at the daily time frame. As we mentioned before the growth from the bottom to $11 was just the wave 1 of the bull run. May be you don't believe me, but the shape of this wave looks like 5 Elliott waves impulse. Correction has a clear zigzag shape and has been finished inside the 0.61 Fibonacci retracement zone. It was ABC in wave 2. We have seen recently the green dot printed by Bullish/Bearish Reversal Bar Indicator . This is strong long signal. As always, alerts from this indicator are automatically replicated on my accounts. You can find the information in our article on TradingView .
The next expected move is the wave 3 inside global wave 3. It shall be rapid without corrections. We expect the nearest target between $19 and $22 in the upcoming 2 months.
Best regards,
Skyrexio Team
___________________________________________________________
Please, boost this article and subscribe our page if you like analysis!

DOTUSDTwe need a retest to create a convergence on D1 after that we can Wait for bullish engulfing candles confirmation for trend continuation if you haven't see something of such no need to jump in, we will be needing more patient to jump in at 4$. So let's wait patiently for it to regain momentum. Not financial advice

sellI expect that we will achieve the goals mentioned below, at least the first goal, which is to purchase the areas in stages.

$DOT Showing Impulse Wave
▶️My primary count shows we're finishing Blue 4, and the next target would be Blue 5 / Black 3 around 12.00.
▶️Price held just above Blue 1 high (purple line a 5.839), so this count stands for now.

Is DOTUSDT Preparing for a Reversal?Yello, Paradisers! DOTUSDT has been moving within a descending channel, presenting a textbook retracement pattern. Now, all eyes are on the crucial support zone, which could be the key turning point for the next move.
💎If DOTUSDT reaches this support zone and forms bullish patterns like a bullish I-CHoCH (Internal Change of Character), a W-pattern, or even an inverse head and shoulders, the probabilities for a bounce significantly increase. This could signal a potential bullish reversal from this critical area.
💎However, in the case of panic selling or deeper retracement, we may see a bounce from the strong support zone below. But remember, confirmation is key—bullish patterns in these zones will strengthen the case for a reversal.
💎If DOTUSDT breaks below the strong support zone and closes a candle there, this would invalidate the bullish setup. In such a scenario, waiting for new price action to develop is the smarter, safer move.
Staying patient and disciplined is essential here. Trade strategically, avoid impulsive moves, and let the market show its hand before jumping in. Remember, the best trades come to those who wait for the highest probability setups.
MyCryptoParadise
iFeel the success🌴

Polkodot Needs one More correctionIf polkodot face another correction and resist on that level, we Can consider another bullish trend begins

DOTUSDT 1WDOT Update ~ 1W
#DOT Still maintaining its bullish structure. This is wave 2. buy in stages from here. With a minimum target of 20%++. Wave 3 is the longest wave in the Eliot Wave pattern.

DOT - Getting ready to bounce back#DOT/USDT #Analysis
Description
---------------------------------------------------------------
+ DOT is forming a higher low and price is getting consolidated within the zone.
+ I'm expecting a clear bounce back from this zone.
+ Price can easily reach the previous ATH
---------------------------------------------------------------
VectorAlgo Trade Details
------------------------------
Entry Price: 7.47
Stop Loss: 4.8
------------------------------
Target 1: 10
Target 2:16
Target 3: 23
Target 4: 31
Target 5: 40
------------------------------
Timeframe: 1W
Capital Risk: 1-2% of trading amount
Leverage: 5-10x
---------------------------------------------------------------
Enhance, Trade, Grow
---------------------------------------------------------------
Feel free to share your thoughts and insights.
Don't forget to like and follow us for more trading ideas and discussions.
Best Regards,
VectorAlgo

DOT is gonna have trouble for bullish movementDOT/USDT Daily Analysis: Inverse Cup and Handle Pattern Emerging
Polkadot (DOT) appears to be forming a bearish inverse cup and handle pattern on the daily time frame, signaling potential downside if the pattern confirms. Here’s the breakdown:
📌 Pattern Structure:
Cup Formation: The large, rounded top indicates a loss of upward momentum, culminating in a clear resistance zone around $7.50-$8.00.
Handle Formation: A minor consolidation or relief rally, currently forming as a descending structure near the neckline, which is a key bearish continuation signal.
📏 Key Levels to Watch:
Neckline Support: The yellow horizontal line at approximately $7.00 is critical. A breakdown below this level would confirm the bearish pattern.
Measured Move Target: The projected downside is calculated by measuring the height of the "cup" and projecting it downward from the neckline. This suggests a potential target near $4.70 (red support zone).
📉 Bearish Case:
A breakdown below the neckline with strong volume could accelerate selling pressure, leading to a significant drop toward the measured move target.
The red arrow indicates the expected price trajectory if the neckline support fails.
💡 Invalidation:
If DOT manages to hold the neckline and break above $8.00, the bearish pattern could be invalidated, opening the door for a bullish move.
📊 Conclusion:
The inverse cup and handle pattern suggests a bearish outlook for DOT/USDT, with a possible move toward $4.70 if the neckline breaks. Traders should watch for volume confirmation on the breakdown and set proper risk management strategies.
Do you think DOT will hold the neckline, or is a breakdown imminent? Share your thoughts! 👇

DOTUSDT - Buying is safe there!Weekly chart displays successful breakout✅ , Retest ✅ of the multi years down trend
Red Area is a very potential support ... buying there is safe
DOT is a strong and highly promising investment project, with many networks built on it.
Accumulate as much as you can within the red zone.
The coin’s targets are very ambitious—$30 is just the beginning, with this target expected to be reached in Q1 2025.
Best regards Ceciliones 🎯

DOT. Consolidation & Recovery. Ready for the Next Breakout.BINANCE:DOTUSDT At the moment, I believe most altcoins have hit their lows, making this an excellent opportunity to look for entry points. After reaching their minimums, prices have entered consolidation phases and started to recover gradually. I expect a return to the structure, brief sideways trading, and a subsequent upward breakout.
The $7.5–$6.7 range looks quite appealing for buys, with targets at $9.712–$11.649.
DYOR.

DOT/USDTThe path I have in mind for this chart is this:
Maybe it will happen, maybe it won't happen
Who knows??

SPOT DOT LONG 24.12.2024Pinning after containment of sales.
🎯Purpose:
10.11
‼️Risk per trade: 0.5% of the allocated funds for spot trading.
Thank you for subscribing and responding🚀.

Dot futures postionsFirst the dot go to leq price and touch the sl of long postions trader after go to the price that show them

#DOT/USDT Ready to go higher#DOT
The price is moving in a descending channel on the 1-hour frame and sticking to it well
We have a bounce from the lower limit of the descending channel, this support is at 6.60
We have a downtrend on the RSI indicator that is about to be broken, which supports the rise
We have a trend to stabilize above the moving average 100
Entry price 7.00
First target 7.30
Second target 7.83
Third target 8.43

DOT/USDTI think wave 3 of 2 is complete. I'm buying with this setup. Only 1% risk. Don't forget capital management.
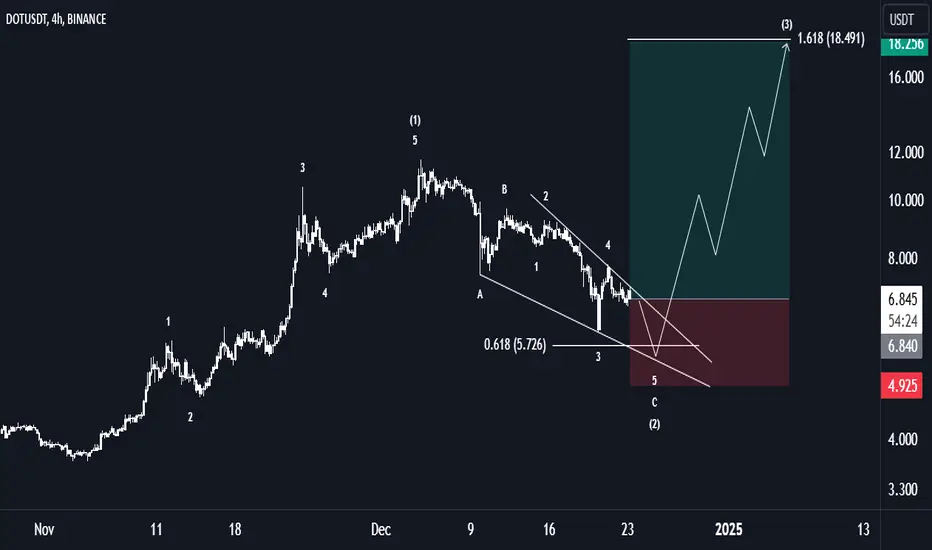
Polkadot Dot usdt Daily analysis
Time frame 4hours
Risk rewards ratio >2 👈👌
Technical analysis base on Eliot waves
The correction 3points (ABC) Eliot waves has finished ✅️
Now, I think, impulse Eliot waves starts . (1-5)
I designed the fist impulse wave on the first branche of main Eliot waves. ✅️
If this analysis happens, we will have a unbelievable alt-season. 🎅💥💥🎅
What's your analysis? 🤔
Do you think impulse wave is started?🤔

Fill Your Bag with DOT !! has just flashed a historical MACD buy signal! Recently, we saw a healthy correction in the market, so there's no need to worry.
If you're considering adding Polkadot to your portfolio, now could be the right time to do so.
Take a look at my previous analysis—it was perfectly timed! Based on the current trends, I believe we could see a minimum price of 40 USD within the next 2-3 months.
As I always say, while you can’t predict the exact timing of the market, this opportunity is worth considering. (Disclaimer: This is not financial advice.)

dot after retrecment!buy area (5.2-3.8)
tp1 (11.648)-(123%)
tp2 (13.59)-(160%)
tp3 (17)-(227%)
lets goOo.

SPOT DOT LONG 21.12.2024Fixation after abnormal activity.
🎯Purpose:
19.232
‼️Risk per trade: 0.5% of the allocated funds for spot trading.
Thank you for subscribing and responding🚀.

Polkadot Elliot Wave - Daily and WeeklyThe analysis shows a completed 5-wave impulse, followed by an ongoing A-B-C correction. Key support at 7.500: a bounce here could trigger Wave 3, with ideal targets between 17.300 and 23.150 based on Fibonacci levels. Watch for volume and breakout confirmation!
