DOTUSD Bullish Money heist PlanMy Dear Robbers / Traders,
This is our master plan to Heist DOTUSD Market based on Thief Trading style Technical Analysis.. kindly please follow the plan I have mentioned in the chart focus on Long entry. Our target is Red Zone that is High risk Dangerous level, market is overbought / Consolidation / Trend Reversal at the level Bearish Robbers / Traders gain the strength. Be safe and be careful and Be rich.
Note: If you've got a lot of money you can get out right away otherwise you can join with a swing trade robbers and continue the heist plan, Use Trailing SL to protect our money.
Stop Loss : Recent Swing Low using 4h timeframe
Warning : Fundamental Analysis comes against our robbery plan. our plan will be ruined smash the Stop Loss. Don't Enter the market at the news update.
Loot and escape on the target 🎯 Swing Traders Plz Book the partial sum of money and wait for next breakout of dynamic level / Order block, Once it is cleared we can continue our heist plan to next new target.
support our robbery plan we can easily make money & take money 💰💵 Join your hands with US. Loot Everything in this market everyday make money easily with Thief Trading Style.
DOTUST trade ideas

DOT USDTDOT/USDT Setup. After a confirmed breakout from the marked zone in green, we could take an entry at 6.535
Remember stop loss is your friend. Everything is on the chart.
Entry 6.535
S.L 6.293
T.P 1 6.736
T.P 2 6.993
T.P 3 7.409

Polkadot (DOT) to $50On the above 4-day chart price action has corrected over 90% since the sell signal back in March 2021. Now is an excellent long opportunity. The reasons?
1) Price action and RSI resistance breakouts.
2) Regular bullish divergence as printed over a 4 month period.
3) Support and resistance. Look left.
4) The target is defined from the falling wedge.
Is it possible price action falls further? Sure.
Is it probable? no
Ww
Type: trade
Risk: <=6% of portfolio
Timeframe: Long from August.
Return: 1000%

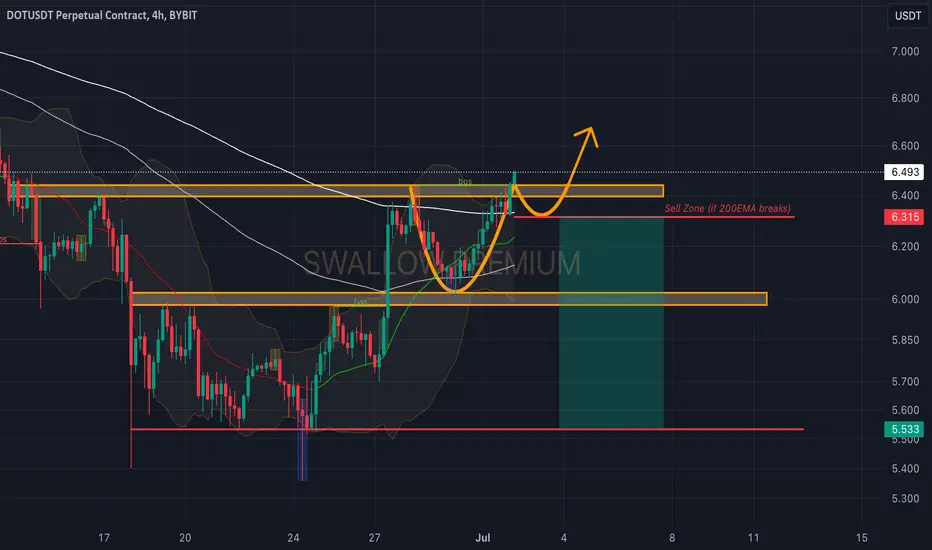
Polkadot (DOT): Possible Rejection From 200 EMAPolkadot is testing again the 200EMA in a 4-hour timeframe. As we have seen this zone work well as a resistance zone, we are looking for another rejection to happen near this zone. As soon as we see clean signs of weakness, we will be looking for another movement to lower zones here!
Swallow Team

Alikze »» DOT | 61.8 Fibo retest scenarioAccording to the long-term analysis, the DOT currency is moving in the 1W time frame, which, as mentioned in the updated micro-waves of the previous post, completed a complete cycle in accordance with the path in the range of 11.92.
💎 First scenario: due to the recent three-wave correction and support in an important PRZ area, an upward corrective movement is currently underway, which is currently stopped at the 0.618 area. Therefore, if this X wave is not upward and after the completion of the correction log until the liquidity zone or PRZ leads to the failure of the zone and the daily candle is closed above it, it can continue the movement until the specified resistance PRZ zone. to give
💎 Second scenario: If the support PRZ area is broken, this can lead to a continuing corrective lag and a combined correction and correct the whole wave up to 0.23.
If the behavior and structure of the post changes, it will be updated.
»»»«««»»»«««»»»«««
Please support this idea with a LIKE and COMMENT if you find it useful and Click "Follow" on our profile if you'd like these trade ideas delivered straight to your email in the future.
Thanks for your continued support.
Sincerely.❤️
»»»«««»»»«««»»»«««

DOTUSDT Poised for Major Bullish Breakout or Risk of Decline!Yello, Paradisers! Have you been tracking #DOTUSDT lately? It's showing some strong signals that could lead to a major bullish continuation from support. Let's dive into the details!
💎After a careful analysis of #DOT price action, we've observed a promising pattern. For a long time, CRYPTOCAP:DOT has been adhering to a descending trendline. Recently, it has successfully retested this descending resistance, assessing key resistance at $6.576, indicating a potential bullish move. If #POLKADOT breaks above the $6.576 resistance and sustains its momentum, we could see a significant bullish continuation.
💎However, due to previous strong bearish pressure, there's an imbalance in the price. It's likely that the price might revisit this level to fill the imbalance. If CRYPTOCAP:DOT fails to initiate an upward movement from the retest level, we should look for a bullish rebound from the lower support at $5.403. On the flip side, if the price breaks below the $5.403 support, this could invalidate the bullish setup and lead to further declines.
Stay sharp and trade smart, Paradisers! Stay disciplined and focused on your trading strategy.
MyCryptoParadise
iFeel the success🌴

DOTUSDTmy entry on this trade idea is taken from a point of interest below an inducement.. I extended my stoploss area to cover for the whole swing as price can target the liquidity there before going as i anticipate.. just a trade idea, not financial advise

DOTUSDT H4 Dot currency. For storage. We put 100 lines under the word storage. I do not trade. Futures contracts, I store currencies. They are for storage, including levels. Frankly, I bought from the $4 levels. I bought from the $4 levels. I bought a respectable amount. Now. It is at $6.25. The first target, as shown in the chart, $11? I sell half the quantity, at $11. And we target $20 to $25 with the remaining half quantity. Good luck to all of you, and any question leave me in the comments.

Will DOT hold the 886?Will Polkadot go for the .886 or will it go for the 1.13 double bottom?
I think double bottom would make more sense as many have the targets on the low side. Many of the alts looks like they will loose another 70-80%

DOT/USDT Trade ideaDOT at bottom low and strong support zone, following previous moves, it can be good opportunity for long term trade.

DOTUSDT D1Poca Dot currency. For storage. We put 100 lines under the word storage. I do not trade. Futures contracts, I store currencies. They are for storage, including levels. Frankly, I bought from the $4 levels. I bought from the $4 levels. I bought a respectable amount. Now. It is at $6.25. The first target, as shown in the chart, $11? I sell half the quantity, at $11. And we target $20 to $25 with the remaining half quantity. Good luck to all of you, and any question leave me in the comments.

#ThoughtsOutLoud On the chart, we see a confirmed upward structure forming on the 2-hour timeframe. I will be looking for an entry point from one of the FWG in the OTE zone based on the Fibonacci retracement from the last move and after a break on the 5-minute chart. The nearest target will be the update of the local high, and the next target will be the 4-hour FTA.


DOTUSDT - Still bullish on DOTThe whole crypto market is in downward trend!!
DOt is still holding major support! if Dot surpass 6 dollars.. we will see upward trends...

DOTCoin #DOT
Accumulation Levels:
4.3 - 3.5 - 3
Average Accumulation:
3.5
Stop Loss:
Weekly close below $2.3
The stop loss will be around 35%, so entry should be with only a portion of the capital.

$DOT - Retest NecklineTarget for double top done already.
Expecting retest the necline to get confirmation.
I am take a long position on DOT
Always use stop loss and always dyor befor take a positioan and make a decision.

DOT Defense Line Coming!!Positioned for a prime breakout higher, however to achieve that mark, it needs to flip 2 essential resistances. Dot faces a turning point sort of resistance at 6.40-6.55 levels. The combination of horizontal and trendlines both meet here.
Stronghold above the trendline opens Dot towards 7.2 primarily followed by 7.60 and 8.40 next.
Decent support at 6.0 and 5.750 levels.

Polkadot (DOT): Potential Cup & Handle Pattern ? Polkadot has broken out of 200EMA and is now looking to break from the final resistance zone.
As we see a new 4-hour candle struggling to break local zones, we are now looking for some kind of rejection. We have 2 scenarios: either we form a cup-and-handle pattern or we will see a rejection from current zones, which would be the start of good downward movement breaking all lower zones!
Swallow Team
DOT ANALYSIS🔮 #DOT Analysis - Breakout 🚀🚀
💲💲 There is a breakout of Falling Wedge Pattern in #DOT and trying to retests the level. It's a 12hr time frame breakout and we will see more higher price in long-term. A successful retest of support could propel a rally 📈📈
💸Current Price -- $6.058
📈Target Price -- $9.051
⁉️ What to do?
- We have marked crucial levels in the chart . We can trade according to the chart and make some profits. 🚀💸
#DOT #Cryptocurrency #Breakout #DYOR


DOT providing a clean Long SetupDOT with a nice bullish market structure break provides a long setup into the buyside liquidity above.
Low hanging fruit target provides the bread.
Good luck :)


DOT's next move.CRYPTOCAP:DOT
I see a bullish divergence on the daily chart at an important support level, and people are freaking out about how they spend money :)
Sorry, but I trust what I see on the charts.
The only invalidation point is $4.50.
If you are still here, here are more of my thoughts...
So what if #DOT paid big influencers to promote their project? Every project does that; it's their marketing strategy. It's good that they are investing in marketing because, in the crypto world, the cycle moves really fast, and to keep up, you need to spend on marketing.
Many projects, including some of your favorites right now, have paid influencers. It's like the death toll shown on your screen daily during the COVID-19 pandemic, which made you worry every day. But in reality, the death toll was almost the same before COVID-19; it was just shown to you daily.
You never know how much #ADA paid influencers. Disliking the idea of paying for and buying inorganic distribution is misguided.
