PolkaDot (DOT) Structure Analysis (1D)BITGET:DOTUSDT is showing signs of strength after a deviation below the long-standing $3.70–$4.10 demand zone.
Key Levels
• 🟢 Demand Zone: $3.70–$4.10, respected since October 2023
• 🟡 Broken downtrend resistance, retested as support
• ⚪ Current falling channel (compression) following range high retest
• 🟥 Sell Order Block: $5.10–$5.40
• 🟧 Range Resistance: $5.40
• 🎯 Target on breakout: ~$7.00, potential extension to ~$7.50
Thesis
• The recent breakdown was quickly reclaimed, hinting at a possible spring/fakeout. After retesting the range high, price is now compressing within a descending channel, building energy just above demand.
• A breakout from the channel followed by an S/R flip of the $4.40–$4.60 region could trigger a rally toward the upper range.
Watching for
• Channel breakout with volume
• Clean break above $5.40 to confirm range expansion
Invalidation
• Sustained break below the $3.70–$4.10 demand zone
DOTUST trade ideas

#DOTUSDT: Targeting $50 By End Of The Year! Wait For Volume ? Hey everyone!
So, about DOTUSDT, it’s been trading sideways at $4 lately. However, it has the potential to break through and hit new highs in the coming weeks or months. We’re not sure exactly what will happen next, but once it does, we expect it to start distributing its value. If this happens, we could see it reach our $50 mark by the end of the year.
I know this is just our speculative view, and we can’t rely solely on technical analysis to make this happen. We also need strong fundamental support. But hey, it’s worth a shot, right?
If you like our work, please give it a like and let us know what you think in the comments. We’d love to hear your thoughts!
Wishing you all the best and happy trading! 😊
We really appreciate your unwavering support! ❤️🚀
And if you’d like to lend a hand, here are a few ways you can contribute:
- Give our ideas a like
- Share your thoughts in the comments
- Spread the word about our ideas
Cheers,
Team Setupsfx_

#DOT/USDT#DOT
The price is moving within a descending channel on the 1-hour frame, adhering well to it, and is heading towards a strong breakout and retest.
We are experiencing a rebound from the lower boundary of the descending channel, which is support at 4.120.
We are experiencing a downtrend on the RSI indicator, which is about to break and retest, supporting the upward trend.
We are heading towards stability above the 100 Moving Average.
Entry price: 4.170
First target: 4.220
Second target: 4.246
Third target: 4.323

DOT/USDT – 1-HOUR TECHNICAL OUTLOOKKey Observations
Factor : Details
Trend-Shift Signal Breakout above the long-standing Descending Channel and the most recent Lower High.
Accumulation Sideways base fuel for the breakout.
Harmonic Confluence Back-testing shows this zone aligns with a bullish harmonic reversal area on the 1-hour chart, reinforcing the probability of trend change.
Trade Plan
Entry : $4.241 (post-breakout retest)
Stop-Loss: $3.940 (below accumulation floor)
Profits should be booked according to your personal risk appetite and reward targets.
🔒 Risk Management Tip:
"True discipline in trading means waiting for the right setup and respecting your stop loss."

POLKADOT Wyckoff AccumulationHere is my long term and swing trade.
Target 1 7$
Target 2 10-12$
Usually DOT will be aggressive after ETH Rocketting

DOTUSDTThe first higher high after a downtrend indicates a potential trend reversal to the upside. It shows that buyers are starting to regain control, signaling the possibility of a new bullish trend.
Trendline Break: A break above a significant trendline further confirms the shift in sentiment from bearish to bullish. The trendline break signifies that selling pressure has weakened, and the market is poised for further upward movement.

DOTUSDT 1D AnalysisDOT ~ 1D Analysis
#DOT Maybe you can consider this support block to start buying back from here with a short term target of at least 10%+, long term target $11.5

$DOT - Polkadot imminent bullish momentumHey traders!
Hope you are doing GREAT!
On this occasion I've decided to spot on CRYPTOCAP:DOT as its showing a clear bullish momentum ( as other alts). The chart is clear about the movement. There is no need to use fancy indicators neither a complex analysis.
Just price action.
As a brief comment, $Polkadot broke a clear bearish trend with confirmation on the daily timeframe. That's why I'm looking for a speculative trade (just in and out).
What I'm targeting? Prices between 6.00 USD and 7.00 USD in short term could be a nice zone to take profits.
Stay tuned!

4.7 / 1.9 RRDot is in an uptrend, the idea would be to catch the next move up. The higher RR is likely to miss the entry--and if entry is filled not reach the indicated target but something more local. The lower RR entry (higher price) is not as rewarding however. Of course you may use local breakout etc entry techniques.

DOT / USDT - Complex H & SMorning fellow traders,
Looking into this market lately, and after the previous short term uptrend the coins have been consolidating a little bit. When looking at DOT / USDT pair we can see something like a cup & handle easier that's starting to develop a handle, but I believe it's a complex head & shoulders.
Take a look at it, I think that before any major move down, creating a possible spring, we could see another move to the upside.
Trade thirsty, my friends.

Polkadot —Higher Low & Bullish ContinuationThis one is time sensitive. Polkadot (DOTUSDT) is about to produce a bullish continuation. The higher low is in and the action just turned green.
The first advance ended 12-May, it's been 16 days. There is almost no retrace, very small but it lasted more than two weeks. This is all normal price action.
The retrace ends in a higher low and the higher low evolves into a new advance or higher high. The next rise will last much longer than the previous one, say, 30 days straight up. This can be the minimum as it can go for longer.
After this advance, which will be a big one, there can be a correction followed by the bull run phase. It is hard to know the specifics because we will have six months of growth with a correction in-between. The correction can last 1 month just as it can last 3 months but no more. Most likely around 2 months, the big one.
This correction will end in a higher low followed by additional growth until we get the cycle top.
Prices are still low. It is still early.
But after the current move that is developing now, it won't be early anymore. Everybody entering the market after the start of this continuation will be late. There will be plenty of room available for growth, but bottom prices will be forever gone.
Namaste.

DOT has HUGE UPSIDE Potential | PolkadotPolkadot could be a late bloomer this season, but there's still much room for growth on this altcoin.
Taking a look at DOT from a macro timeframe, we clearly see the bearish cycle after the ATH, and then a bottom out when we start to see the price making higher lows.
This undoubtedly shows us that Polkadot IS CURRENTLY bullish - even though we're not seeing the big increases just yet. After a retest here in the pointed out area, it's likely DOT can run. DOT and other alts will likely retrace as ETH gears up and starts increasing, before they get their turn to run:
It should be noted that DOT is trading over 1000% away from its previous ATH. And even though that may be a stretch, I'd be happy with a 100%!
Don't miss the SOLANA update with a trade setup 🎁 :
____________________
BINANCE:DOTUSDT

Polkadot Eyes $5.38 – Is a 17% Rally on the Horizon?As of May 26, 2025, DOT/USDT is showing signs of a potential bullish reversal on the 4-hour chart, forming a strong setup for upward movement. Key technical levels and chart structures support this bullish outlook.
1. Strong Support Zone
• Zone: $4.30 – $4.37
• This area has acted as a major support, where buyers previously stepped in, leading to strong upward moves. Currently, the price has rebounded from this support zone, suggesting renewed bullish pressure.
• A bounce from this zone with increasing volume confirms the strength of this level and validates it as a demand zone.
2. Bullish Entry Setup
• The entry appears to be positioned slightly above the support zone, near $4.60.
• The risk-to-reward ratio is favorable (~2.7), indicating a well-placed setup for swing traders.
• A small stop-loss (~6.36%) below the support at $4.30 protects against a false breakdown.
3. Key Resistance and Target Levels
• TP1 / Recent Resistance: $4.93
This level marks a recent swing high and minor resistance. A breakout above this would confirm short-term bullish continuation.
• TP2 / Major Resistance: $5.38
This is the major resistance level and final take-profit zone. It aligns with a previous market top, and its breach could lead to further bullish continuation into a higher timeframe breakout.
4. Projected Path and Price Action
• The chart outlines a bullish projection path, anticipating higher lows and higher highs forming a stair-step rally.
• This dotted path suggests a bullish trend structure with gradual momentum buildup.
• Buyers may continue pushing the price upward through TP1 toward TP2 in the coming sessions, especially if macro conditions or Bitcoin price action remain favorable.
5. Market Structure & Candlestick Behavior
• The market recently transitioned from a short-term downtrend into a consolidation phase.
• Bullish candlestick formations around the support zone imply accumulation.
• The recent bullish engulfing near the support further confirms buyer dominance and a potential trend reversal.
6. Risk Management and Outlook
• Stop-Loss: Below $4.30 to manage downside risk.
• Target Zones: $4.93 (TP1), $5.38 (TP2).
• A break below $4.30 would invalidate the bullish thesis and suggest caution.
• As long as DOT remains above the $4.37 zone, the bullish scenario remains intact.
Conclusion
DOT/USDT is currently in a bullish setup on the 4-hour chart with a high-probability reversal from the support zone. Traders may look for confirmation candles and volume support to enter long positions with TP1 at $4.93 and TP2 at $5.38. Risk remains contained below the $4.30 level.

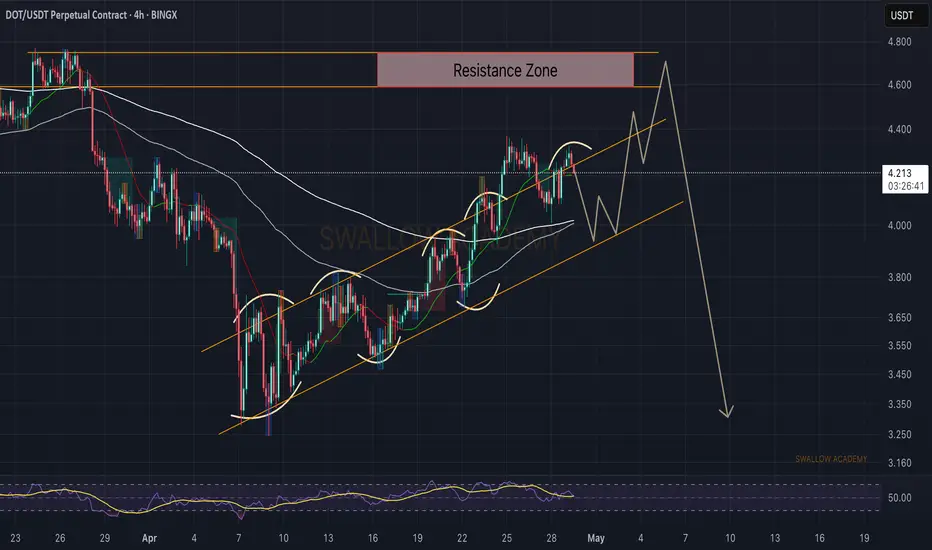
Polkadot (DOT): Seeing Good Shorting EntryPolkadot is showing a decent entry forming where price has been pressuring the upper side of the bullish trend and even formed a nice fakeout above it.
We are looking for further weakness to kick in where price will fall back to bullish trends support line from where we might be heading toward the resistance zone. After that we will be looking for bigger downward movement.
Swallow Academy
DOT/USDT: Elliott Wave Setup - Potential Rally to $9.60-$13.60Polkadot (DOT) Daily Elliott Wave Long Setup: Targeting Key Resistance
Polkadot (DOT) | Timeframe: 1 Day (1D) | Exchange: Coinbase
Current Price (approx.): $4.60 - $4.80 (as of May 24, 2025)
Market Cap (approx.): $7.3 Billion USD
Analysis:
Based on my Elliott Wave analysis on the 1-day timeframe, DOT appears to be positioning for the next significant leg up within its broader structure.
Trade Setup:
Trade Type: Long
Entry Zone: $3.80 - $4.80
Expected Target Range: $9.60 - $13.60
Invalidation / Stop-Loss: $3.23 (Crucial level for the Elliott Wave count)
Rationale (briefly):
This setup anticipates a strong bullish move for DOT, supported by the specific Elliott Wave count and the defined invalidation point. The entry zone aligns with current price action, offering a potential re-accumulation area before the projected rally.
Your Elliott Wave count (labeling the waves you are trading).
The entry zone ($3.80 - $4.80).
The target range ($9.60 - $13.60).
The invalidation level ($3.23).
Any supporting technical observations (e.g., trendlines, support/resistance, indicators) that led to this setup.
Risk Management:
Always implement proper risk management. This trade idea has a clear invalidation point at $3.23. A break below this level would negate the bullish Elliott Wave count and necessitate exiting the position.
Disclaimer: This is not financial advice. Elliott Wave Theory is subjective and can be interpreted differently. Always conduct your own research and manage your risk. Cryptocurrency trading is highly volatile and carries significant risk of loss.

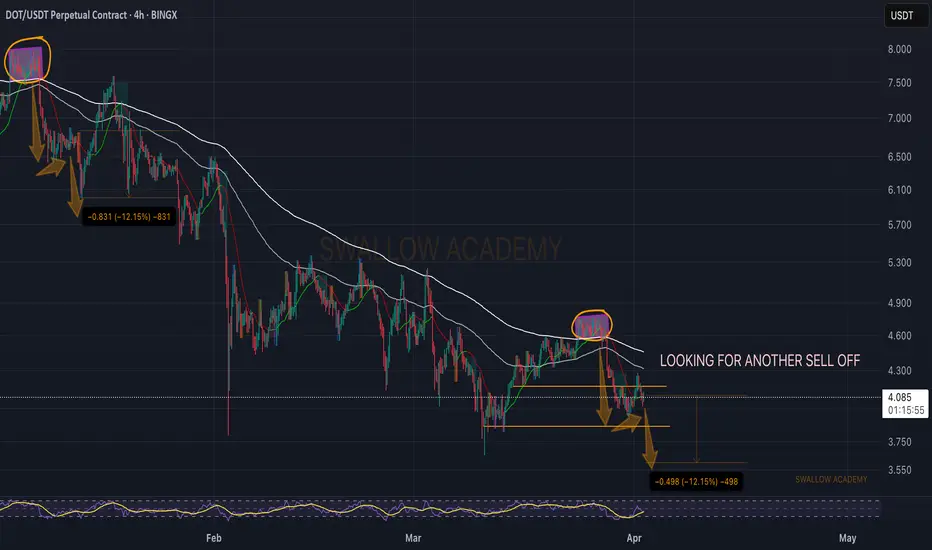
Polkadot (DOT): 3 Trading Setups We Are Looking For The Most Sellers are slowly overtaking the current zone near the 100EMA, where we might go and grab the bearish CME gap. We have detected 3 possible trades that we can take so let's wait for confirmations!
More in-depth info is in the video—enjoy!
Swallow Team

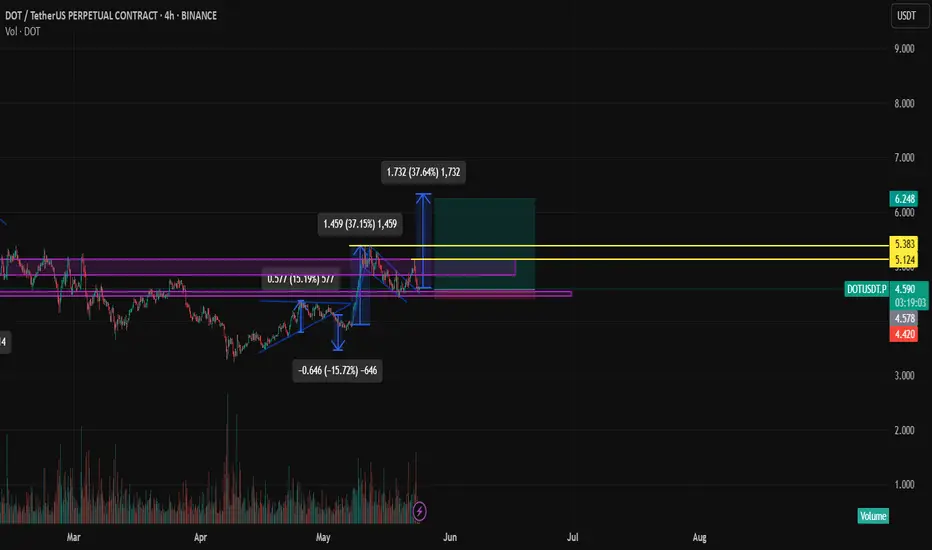
Polkadot (DOT): Similarity Can Be Seen, Another Smaller Drop?Since the last time when we noticed this movement and similarity, price has formed the first drop and smaller recovery, where now we are looking for the second drop to happen on the coin.
Nothing much, just a smaller movement but still a good place to take a trade!
Swallow Team
DOTUSDT , 1HrPattern is looking Good , If BTC is Sustaining Above 1,06,834 this level then , This DOT pattern will Give a Good Breakout ,
Enter only When Upper Trendline is Breakout
Take Your Own Risk According to your Capital .
Follow for More Ideas Like This

DOT Testing Bull Flag – Breakout or Retest Incoming?🔥 CRYPTOCAP:DOT – Bull Flag Watch (4H TF)
On the 4-hour timeframe, DOT is attempting to break out of a bull flag — a pattern that often signals continuation if confirmed 📊
📈 A breakout with strong volume and close could push DOT toward its previous highs and beyond 🚀
📉 But if momentum fades, a retest of the midline or lower boundary may follow.
⚠️ The next few candles are critical — stay sharp and watch closely!
DOT/USDT breakout alertDOT/USDT breakout alert
DOT has broken out of the bull flag pattern and is currently showing bullish momentum. The bull flag is a continuation pattern, and this breakout suggests the potential for further upward movement if the breakout holds with strong volume.
However, if the price falls back into the flag channel, it could be a fakeout, so it's important to monitor closely.
Key levels to watch:
* Breakout confirmation zone
* Flag support area
* Volume strength for confirmation
Keep an eye on DOT — a confirmed move above the flag could trigger the next leg up.
DOTUSDT Potential UpsidesHey Traders, in today's trading session we are monitoring DOTUSDT for a buying opportunity around 4.20 zone, DOTUSDT is trading in an uptrend and currently is in a correction phase in which it is approaching the trend at 4.20 support and resistance area.
Trade safe, Joe.

Polkadot (DOT/USDT) Ready to Explode? Full Technical Breakdown Hello everyone!
In today’s idea, I’ll be breaking down the technical analysis of BINANCE:DOTUSDT . I hope you find this analysis valuable and insightful for your trading decisions.
On weekly TF
- There was a huge liquidity sweep on the bottom of 4 AUG 2024 on APRIL 2025
- As shown in the chart above, the MACD has started to cross bullishly on 1W timeframe. The last time this occurred, DOT rallied by approximately 200%.
- Two weekly candles have closed above the previous high that led to the last bottom (around $4.772), signaling a market structure shift from bearish to bullish.
On 4D TF
- On the OBV , a downtrend line was broken, and a retest is currently in progress.
- There is a very important Fair Value Gap (FVG) being retested right now.
- Note: The 4D candle closes today. Monitor closely to see if it closes above the FVG — respect the FVG.
- A good potential entry zone is between $4.44 – $4.241.
In conclusion, DOT/USDT is showing promising bullish signals across higher timeframes, with a potential entry zone between $4.44 – $4.241. As always, manage your risk and wait for confirmation before entering. I’ll be watching the 4D close closely — stay sharp!
