DOT/USDT Swing Long Setup | 4H Chart AnalysisDOT has retraced into a multi-layered support zone that presents a high-probability long opportunity:
Golden Pocket: Price is reacting near the 0.618–0.786 Fib retracement from the latest impulse
200 EMA (Dynamic Support): Clearly acting as a trend defender and bounce area
Previous structure flip zone: Former resistance around $4.25 is now tested as potential support
Volume Profile: Strong participation and activity around the current zone
Current price is showing signs of buyer interest with long lower wicks and has yet to break below key EMAs or structural levels, keeping the bullish thesis valid.
Trade Plan:
Entry Zone: $4.25–$4.35
Stop Loss: Below $4.10 (structure + Fib zone invalidation)
Target 1: $4.66 (Fib 0.5 + local resistance)
Target 2: $4.95–5.05 (Fib 0.236 + prior high region)
RR Ratio: ~1:2+ depending on entry
A clean breakdown below $4.10 with strong bearish volume would invalidate the long setup and potentially signal deeper retracement.
Like & follow if this setup adds value to your trade planning
#DOT #Crypto #SwingTrade #TechnicalAnalysis #Altcoins #USDT #TradingView #Fibonacci #200EMA #BullishSetup #MarketStructure
DOTUST trade ideas

DOT MASSIVE PUMP LOADINGDOTUSDT did bullish BOS and now its retesting it and also trying to fill internal liquidity FVG. i will buy here as a swing trade.

dot 1hThere is a double top image in many coins. Polkadot may also close below 4.95 and bring 4.61 levels.

DOT Breakout Setup – Major Resistance Test Ahead🚨 DOT – Key Breakout Levels in Focus
🗓️ Daily Chart: DOT has broken out of an ascending channel and completed a clean retest—momentum looks solid. 🔥
📉 Weekly Chart: Price is now approaching the trendline resistance of a descending triangle—this is a crucial level.
👀 Watch closely—if DOT breaks through, it could spark a much bigger move!

DOTUSDT Potential UpsidesHey Traders, in today's trading session we are monitoring DOTUSDT for a buying opportunity around 5.030 zone, DOTUSDT is trading in an uptrend and currenty is in a correction phase in which it is approaching the trend at 5.030 support and resistance area.
Trade safe, Joe.

DOT - Yippie's Cup & Handle DelightHiya!
Check out this treat! & don' miss out on it! :D
Yippiekiaye says cheers!

PolkaDot DOT Let's Wait Agains The CrowdHello, Skyrexians!
As I mentioned in the recent BINANCE:DOTUSDT analysis the bounce to approximately $6 was predictable and very likely. Now it's happening. Green candles caused a lot of greed again, yesterday I checked the sentiment sharing some bearish minds in Tradingview and got a lot of negative. What's a pity, but the market again is not ready for altseason.
In this case we have now the following scenario. Recent divergence on Awesome Oscillator was just the wave 5 in 3 finish, now we have wave 4 which can be finished inside the $5.2-6.4 area. Then I expect wave 5 which has the target inside $2-3 in the best case. About the worst scenario I don't want even to talk now. Bear market is not over for alts, don't be greedy.
Best regards,
Skyrexio Team
___________________________________________________________
Please, boost this article and subscribe our page if you like analysis!

DOT Breakout from Red Resistance – Target Ahead!🚀 CRYPTOCAP:DOT Breakout from Red Resistance – Target Ahead! 📈
CRYPTOCAP:DOT has broken out of the red resistance zone! 📊 The target could be the green line level as the price continues to rise! 🔥
Let’s catch this breakout together! 💼💸

DOTUSDT Potential UpsidesDOTUSDT is currently trading within a broader uptrend and is in the midst of a correction. Price action is approaching the $4.60 zone, a key support and resistance level that aligns with the trend structure. This area may act as a pivot point for future movement, as the market continues to respect the prevailing bullish momentum.
Trade safe, Joe.

DOT breakout alertSuccessfully breakout this resistant line with a short -term target of at least +10%

Polkadot Next Target Confirmed ($16.8 —PP: 285%)My sources within the Cryptocurrency market have confirmed the next target for Polkadot (DOTUSDT) in the short- to mid-term, that is a target of $16.8 for total profits potential of 285% from current price.
There is a full bottom reversal complete based on an inverted head and shoulders pattern (iH&S). The pattern is complete and a recovery is happening above the neck line.
Today's candle/session is full green and hitting the highest price on a rise since mid-March.
The above target confirmed by my sources is a very easy target. There is also a target at $8.42 yielding some 100% and is very, very easy.
After these targets are hit, Polkadot will continue to grow long-term and even extend to reach a new All-Time High in late 2025.
Bullish momentum is starting now and will grow daily, more and more, over and over until maximum momentum is present. Expect everything Crypto bullish next.
Thank you for reading and for your continued support.
Namaste.

DOTUSDT UPDATE
DOT Technical Setup
Pattern: Falling Wedge Breakout
Current Price: \$4.28
Target Price: \$7.32
Target % Gain: 75.83%
Technical Analysis: DOT has broken out of a falling wedge on the 1D chart, with a strong bullish candle and 7.86% daily gain signaling momentum. Breakout suggests potential upside continuation.
Time Frame: 1D
Risk Management Tip: Always use proper risk management.

DOTUSDT: $10 Targeting, Price is at critical level! Hey there everyone
The pair is at a pivotal point where we might see a surge in bullish activity. Remember how price has acted in the past? Well, we can expect something similar, leading to a sudden jump to $10. It’s a fantastic opportunity, but it also comes with a fair bit of risk.
Wishing you all the best and happy trading! 😊
We really value your unwavering support! ❤️🚀
If you’d like to lend a hand, here are a few ways you can contribute:
- Give our ideas a like
- Share your thoughts in the comments
- Spread the word about our ideas
Cheers,
Team Setupsfx_

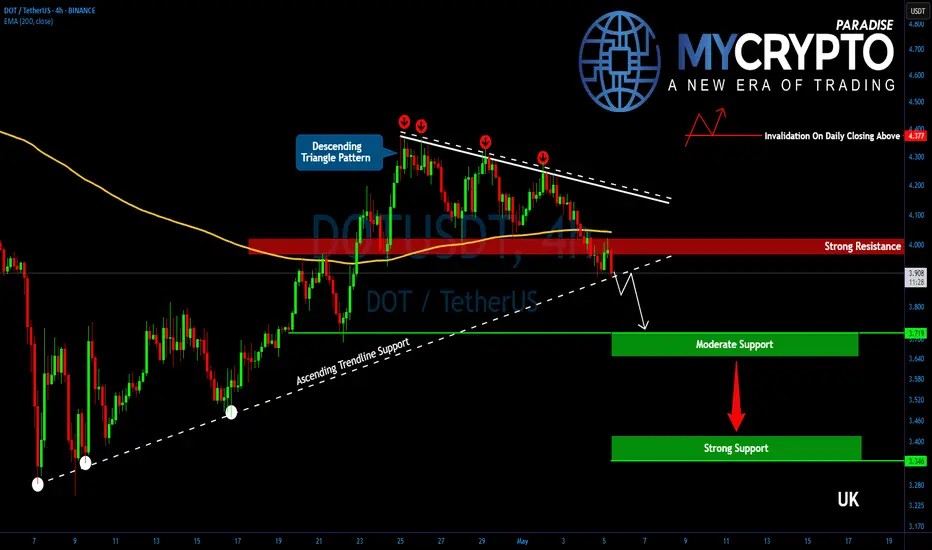
DOTUSDT Is Hanging by a Thread! Breakdown Ahead?Yello, Paradisers! Is #DOT about to hit new yearly lows? The structure is getting ugly again—don’t get caught off guard as this setup is starting to turn dangerous fast.
💎After a brief and weak corrective bounce, DOTUSDT is once again losing steam. The price has already broken down from a descending triangle—a bearish continuation pattern—and is now threatening to breach its key ascending support level. Momentum is shifting aggressively back in favor of the bears.
💎#DOTUSDT is now hanging to the critical $3.90 support level. A decisive breakdown below this zone would likely trigger another wave of selling pressure, opening the door for a drop toward the next moderate support range at $3.72 to $3.65. While this area could attract some short-term profit-taking, the broader trend remains clearly vulnerable, with bearish momentum continuing to dominate.
💎Should bearish pressure continue, and it’s highly likely at this stage that DOT could fall all the way toward the stronger support zone between $3.40 and $3.35. This region marks the 52-week low, and it's where bulls might step in to defend and attempt a meaningful rebound.
💎Additionally, the 2-hour EMA-200 has shown itself to be a strong trend guide. Every time DOT traded above it, bulls had a slight edge. But now that price has once again broken below this moving average, momentum is back with the bears.
Paradisers, strive for consistency, not quick profits. Treat the market as a businessman, not as a gambler.
MyCryptoParadise
iFeel the success🌴
DOT NEXT TARGET ??CRYPTOCAP:DOT Polkadot is trading near the lower boundary of the parallel channel pattern on weekly timeframe👀
Strong buying and increased volume suggests accumulation at this critical support zone🧐
If support holds, expect price to bounce towards targets at $6.10, $7.90, $11.00 and $16.00🎯

Polkadot Setup Unfolding - Wait for the Breakout!🔍 Polkadot (DOT/USDT) Technical Breakdown
Currently analyzing DOT/USDT, and when we zoom out to the higher timeframes (📆 weekly and daily), it’s clear that price remains in a macro bearish trend 📉. We’ve recently seen a deep retracement into the upper end of the range — a region I would classify as premium pricing 💰.
Despite the recent bullish momentum 🔼, I'm exercising caution when it comes to long positions. From a value perspective, this isn’t where I want to be buying. Instead, my bias leans bearish — but only if specific criteria are met. ✅
I'm watching closely for a clear break of the current range, ideally with:
1️⃣ A market structure break
2️⃣ Strong price displacement (to confirm intent)
3️⃣ A shift in order flow and momentum to support a downside move 🚨
These concepts are influenced by a blend of Wyckoff theory and ICT (Inner Circle Trader) principles 🧠, which I walk through in detail in the video.
📚 As always, this is for educational purposes only — not financial advice. 💼❌

DOTUSDDOT is retesting the breakout line which coincides with the bottom of the upward channel.
Support level: $3.96
RSI is bullish.

DOT/USDT 1H Chart UpdateDOTUSDT broke its Long-Term Resistance last week!
After consolidating in a Redistribution phase (similar to mid-April), Polkadot is now testing the $4.00 support zone.
▸ Bullish Target: If $4.00 holds, we could see a climb to $4.50 or higher!
▸ Bearish Risk: A breakdown below $4.00 might push the price to $3.90 or lower.
Eyes on $4.00 — will the bulls defend this level? Let’s talk!

Triple Triangle Pattern Hints at Major DOT BreakoutThe DOTUSDT pair on the weekly timeframe is showing a strong pattern of historical buying interest around the $3.565 support zone. This level has been tested four times since October 16, 2023, and each time it has acted as a critical point for bullish reversals, forming triangular pricing channels.
Key Observations
Repeated Support Test at $3.565
DOT has tested the $3.565 support level approximately four times:
October 16, 2023
November 4, 2024
April 7, 2025
Most recent touch in late April 2025, briefly dipping below to trigger buy orders.
Triangular Pricing Channels
Each bullish reversal from this level formed a triangular pattern:
Channel 1: Formed between Oct 2023 – March 2024
Channel 2: Nov 2024 – Feb 2025
Projected Channel 3: Currently forming; expected to play out similarly
Resistance Zone
A strong resistance level at $11.705, which capped gains in both previous triangle patterns.
This level aligns with the projected peak for the next bullish leg.
Bullish Momentum Building
The recent price action has again bounced from the critical support zone, signaling a likely bullish continuation.
The market may attempt to complete a third triangular cycle towards the $11.70 resistance zone.
Trade Setup (Based on Chart Projection)
Entry Point: Around $4.326, close to the current price and above support confirmation.
Stop Loss: Set just below support, at $3.293, accounting for potential fakeouts or liquidity grabs.
Take Profit: Targeting the upper resistance at $11.705, matching historical triangle peaks.
Risk/Reward Analysis
Potential Gain: ~+140.57% (from $4.326 to $11.705)
Potential Loss: ~-23.88% (from $4.326 to $3.293)
Risk/Reward Ratio: Approximately 1:6, indicating a high reward relative to risk, suitable for swing traders.
Conclusion
The weekly chart of DOTUSDT shows a strong historical pattern where the $3.565 level has consistently acted as a springboard for bullish reversals. With a clear triangular pricing structure repeating over time, a potential third bullish wave is now unfolding. A long position near current levels offers an attractive setup with well-defined risk management and a compelling reward potential toward the $11.70 resistance.

DOTUSDT 1D AnalysisDOT ~ 1D Analysis
#DOT Buy when re -testing this support with a short -term target of at least 10%+ from here.

DOT RectangleBITGET:DOTUSDT has been trading in a rectangle since October 2023, with important key levels dating all the way back to May 2022. It also recently broke support, swept liquidity to $3.3 and reclaimed the demand zone, setting itself up for a potential rebound.
Key Levels to Watch
• $3.5-$4.0: Main demand zone
• ~$7.5: Rectangle midline + key S/R dating back to May 2022, could act as a strong resistance
• $10-$12: Main supply zone
Potential targets
Measured rectangle targets
• Breakout: $20
• Breakdown: $1.0
Other Considerations
Another laggard, similar to Filecoin ( ).
While it's still unclear whether these coins are rebounding or heading for a breakdown, they could offer some of the highest R/R potentials for longs, and they have very clear invalidations.
Triggers
• My long trigger for Polkadot would be a break above the 50-day EMA and the demand zone (~$4.0).
• Invalidation (and short trigger) would be a sustained break below $3.5 or a lower low below $3.3.
DOTUSDT LONG/BUYBy utilizing Fibonacci retracement levels, historical patterns, , we can formulate a hypothesis that the market might follow a similar trajectory if bullish sentiment prevails.

DOT HVFDOT showing us a nice upside HVF pattern on the 15 minute chart. 9.7 risk award ratio for around a 7% move with a target around 4.6 following bitcoin and other Altcoins HVF structures to the upside
