DOT the most important historical support!DOT / USDT
The price just toke the liquidity and come back above the most important suppprt level in dot chart with long green wick (strong buy action)
As long as the price continues to close above the current level we think for strong bounce in the coming weeks
However, if and only if the price lose this level on HTF DOT will make new lows
Conclusion: this support acts as DO or DIE for future price action … bullish as long as it stay above it but if it lost on HTF it will into strong bearish
Note: many coins have same chart
Best of wishes
DOTUST trade ideas

DOTUSDTIt should be at $6 and then a correction and a rally to $12 and then a stronger correction and finally a major rally to $24.210
Market geometry is doing its job

dotim not really a fan... but its time
Im just seeing opportunities to go long on good value tokens.
None of this is financial advice, im just pointing out that if you are patient and know what you are looking for then the right times to trade are easy to spot.
my long strat has triggered

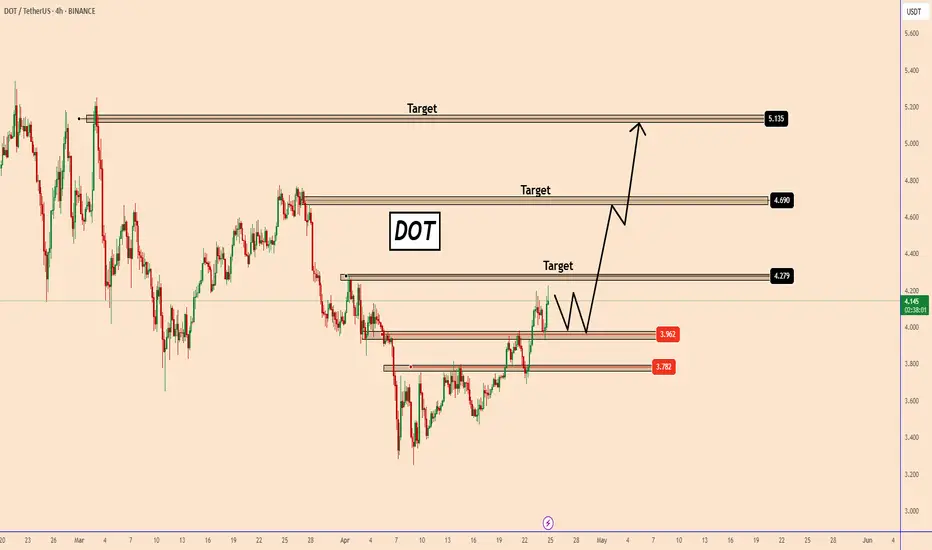
DOT's Bullish Momentum: Key Levels to WatchDOT's Bullish Momentum: Key Levels to Watch
Since April 13, DOT has been forming higher highs, confirming a bullish trend.
The price has already built two strong highs and looks set to begin another upward move.
Before that happens, DOT may linger in the current zone, possibly retesting $3.96.
However, once this level holds, the bullish trend is expected to resume, as shown on the chart.
Key resistance zones to watch:
$4.27
$4.69
$5.13
Once DOT breaks above a resistance level, the next zone becomes the target.
You may find more details in the chart!
Thank you and Good Luck!
❤️PS: Please support with a like or comment if you find this analysis useful for your trading day❤️
#DOT/USDT#DOT
The price is moving within a descending channel on the 1-hour frame, adhering well to it, and is heading towards a strong breakout and retest.
We are seeing a bounce from the lower boundary of the descending channel, which is support at 4.05.
We have a downtrend on the RSI indicator that is about to be broken and retested, which supports the upward trend.
We are looking for stability above the 100 moving average.
Entry price: 4.08
First target: 4.10
Second target: 4.15
Third target: 4.20

DOTUSDT: On The Way To $12 By End Of Year ? BINANCE:DOTUSDT The price of BINANCE:DOTUSDT has taken a turn, and it looks like it’s gonna follow the same pattern. Right now, the market is bullish, and we can see the price heading towards our target in the coming weeks.
Good luck with your trades
Thanks for your support! 😊
If you want to help us out, here are a few things you can do:
- Like our ideas
- Comment on our ideas
- Share our ideas
Team Setupsfx_
❤️

DOTUSDTdown trend, supply zone in 4H, v-formation, and pull back. it could reverse to the down side again from here

Polkadot (DOT): Possible Good Buying OpportunityPolkadot has been gliding in that bullish trend where price is approaching the bullish CME gap, which is our smaller target as of now. There we are expecting to see some sort of struggle and rejection until we reach again the lower side of that trend.
Keep in mind, if we break the trend, we will be looking for a short position outside the channel, which would result in a possible move to $2.30.
Swallow Academy


It's disappointing !!!Do you think this will happen, or do you see DOT below $3.5 in the future?
Give me some energy !!
✨We spend hours finding potential opportunities and writing useful ideas, we would be happy if you support us.
Best regards CobraVanguard.💚
_ _ _ _ __ _ _ _ _ _ _ _ _ _ _ _ _ _ _ _ _ _ _ _ _ _ _ _ _ _ _ _
✅Thank you, and for more ideas, hit ❤️Like❤️ and 🌟Follow🌟!
⚠️Things can change...
The markets are always changing and even with all these signals, the market changes tend to be strong and fast!!

DOT About to Break Down? Don’t Fall for the TrapYello Paradisers! Could this "bullish" pump on DOTUSDT be leading traders straight into a bear trap?
💎DOTUSDT is currently forming an ascending channel, which is historically a bearish pattern. These setups often lure in breakout traders before reversing sharply, shaking out weak hands and triggering stop-losses.
💎The price is now approaching a critical resistance zone, where the Fibonacci golden pocket overlaps with the 200 EMA — a powerful confluence. If DOTUSDT grabs liquidity above the recent highs, it would significantly increase the probability of a bearish reversal from that region.
💎For safer, more conservative traders, the best strategy here is to wait for confirmation of a bearish pattern within this area. That would offer a stronger risk-to-reward ratio while allowing more control over trade execution. Patience pays, especially when the market tempts you with low-conviction breakouts.
💎However, if price breaks out and closes decisively above the invalidation level, then the entire bearish idea becomes invalid. At that point, it’s essential to step back and reassess the structure rather than forcing a trade.
Discipline is what separates professionals from gamblers. This setup demands patience, a level head, and an understanding of risk management.
MyCryptoParadise
iFeel the success🌴

Dot prediction price New Data from dot project can show that price could have been shown 2.9 $ per token

long Dot from 3.65 to 6 dollars DOT has come to the lower band on the weekly chart. failed to break it which is a sign of bullish and trend reversal.
On the same weekly chart we have a hidden divergence and a pin ball candle on the week of 7/04/2025.
weekly divergence
On the daily chart we have now formed a lower high with divergence.
Very bullish and BTCD is also showing signs of topping out

Polkadot (DOT): Can Fall Another 10%Polkadot can drop another 10% from current zones where we are seeing similar market structure development like we had last time we formed a fakeout above the EMAs.
More in-depth info is in the video—enjoy!
Swallow Team

Polkadot (DOT): One of Best Spot Buy Entries / Good Risk:RewardPolkadot is back at that major support zone after getting another rejection from the resistance area.
Now we are seeing a few things here. Each time we reach the local support zone, which has been forming since 2023, we see a strong overtake of buyers, and after some time we experience a positive upward movement that doubles the price.
We are looking here to see yet another upward movement, thoughts?
P.S: Keep in mind that current market situations are pretty bad so we might fall lower, but this is still a good opportunity trade that can be taken in our personal opinion.
Swallow Team

Short-Term Short Position DOT/USDT🔴 DOT/USDT – Approaching Key Short Zone
Polkadot (DOT) has formed a rising wedge after rebounding from local lows. Price is now facing a critical short zone near 3.897 – 3.985, where sellers may step in if DOT cannot sustain upward momentum.
Chart Formation: The rising wedge often indicates potential bullish exhaustion; a break below wedge support confirms a bearish bias.
Volume Consideration: Look for a surge in sell volume near entry levels to validate a short entry.
🔴 Short Position DOT/USDT
🎲 Entry Levels
Entry 1: 3.897
Entry 2: 3.985
✅ Take-Profit Targets
TP1: 3.798
TP2: 3.648
TP3: 3.472
TP4: 3.256 (extended downside if momentum persists)
❌ Invalidation Level: 4.131+
(A strong close above 4.00+ invalidates the short setup.)
🧠 Narrative: This wedge suggests a potential bearish retest if DOT fails to break higher. A rejection at 3.89 – 3.98 may send price to lower supports.
Market Context: Overall market sentiment and Bitcoin’s trend can influence DOT’s movement; a strong BTC rally could negate this setup.
⚠️ Risk Management: Place stops just above 4.131+, size positions carefully, and stay flexible if price action indicates continued strength above the wedge.
"Take Care of Risk Management for Your Account"

Polkadot: 580% An Easy WaveThis one here for Polkadot in the coming months would be an easy wave. A bullish wave that reaches 580% profits from the current level, why is that?
The Cryptocurrency market is set to enter uncharted territory. We still don't know how things will play out.
Will the market really produce the classic 6-12 months bull market after such a strong bearish cycle? Or, will the market enter a new period where Cryptocurrency becomes a new monetary standard, the default global medium of exchange?
Can a Cryptocurrency project grow for 2 years, 3 years or 10 years straight?
Are there any laws in finance or nature that prohibits the market from growing really strong?
Is there anything in this world that says, "Crypto mustn't grow!"?
The truth is that such force existed and it was pretty obvious. When this force was live and active, Cryptocurrency was having a hard time just trying to survive. While surviving, Cryptocurrency still managed to grow and did so strongly.
Right now things are different, we have the support of the biggest power in the world. Instead of surviving, we are entering a thrive phase. We are going up and it will huge, wild; who is to say that the bull market cannot extend?
Anything goes. Everything is possible, that's why 580% is an easy target for this pair.
Since the next All-Time High will go off this chart, such an easy target should happen within months, say within 90 to 120 days.
That's it. The market will grow.
Accept it and enjoy bottom prices. The best time to buy is when prices are low.
Prices are low now.
The time to buy is now.
You will be happy with the results.
Namaste.

DOTUSDTin 15 min
2 TP
TP1 : 3.543 60%
We are likely to see another price drop
to the marked areas and given the price gap on the Bitcoin chart
be careful with positions

PolkaDot DOT Is Ready For BounceHello, Skyrexains!
Looking at the dominance charts recently we predicted the altcoins run-up in the upcoming weeks and BINANCE:DOTUSDT will definitely take part in this bounce.
Let's take a look at the daily chart. Here we cans see that impulse could be already finished. We have 5 waves, true divergence between waves 3 and 5. The only one thing is that price has not reached the wave 5 target area inside the green box. But momentum is already reversing and if we will see the third green column on Awesome Oscillator it's going to be the huge confirmation for reversal. It's difficult to say if this is bear market bottom or not, but the bounce to $6.5 is very likely in April.
Best regards,
Skyrexio Team
___________________________________________________________
Please, boost this article and subscribe our page if you like analysis!

DOT in coming days ...As you can see, the price has now formed an ascending wedge , which is promising. The price could rise to $5 after breaking this wedge...
Give me some energy !!
✨We spend hours finding potential opportunities and writing useful ideas, we would be happy if you support us.
Best regards CobraVanguard.💚
_ _ _ _ __ _ _ _ _ _ _ _ _ _ _ _ _ _ _ _ _ _ _ _ _ _ _ _ _ _ _ _
✅Thank you, and for more ideas, hit ❤️Like❤️ and 🌟Follow🌟!
⚠️Things can change...
The markets are always changing and even with all these signals, the market changes tend to be strong and fast!!

we are going bullish soonwe are going bullish soon ,its respecting sib levels and rsi indicates bullish pattern risght away ,emas are reacting as support ,waiting for one bullish engulfing canlde to confirm longs,good time to buy spot

DOT LONG m15
A bullish position on Polkadot (DOT), aiming to profit from upward price movement. Traders enter a DOT LONG when expecting the value of DOT to rise, leveraging market trends, technical indicators, or fundamental news. Ideal for confident bulls who believe in Polkadot’s potential and want to capitalize on its momentum.
---
Let me know if it's for a specific use—like a job ad, internal training doc, or trading platform—and I can tweak the tone or detail.

DOT/USDT - History repeats itself?( BINANCE:DOTUSDT.P ) Weekly Chart Analysis
We’ve seen two major rallies from the same support zone on DOT's weekly chart:
First rally: +199.40% 🚀
Second rally: +217.44% 🚀
Both moves started from nearly the same base, highlighting a strong historical demand zone around the current price area (~$3.6) ⚡️
Currently, DOT is once again hovering near this historical support. If the pattern continues, we could expect another potential rally.
While there are no guarantees, this zone has proven to be a high-probability accumulation level in the past.
---
For Spot Traders 💰
Accumulation zone: $3.4 – $3.7
Great for DCA (dollar-cost averaging)
Medium-to-long-term hold potential if the pattern repeats
---
For Futures Traders ⚔️
Wait for confirmation (e.g., the price starts trading above the support zone, bullish engulfing weekly candle, reclaim of key moving averages)
Potential target zone: $6 – $8+
Risk management is key:
Use SL below recent lows
For futures: Allocate only 1–3% of your portfolio
---
Keep an eye on DOT in the coming weeks – volume and structure confirmation will be crucial for spotting the next big move!
What are your thoughts? Will DOT pull off another rally from here? Drop your analysis below!
And don’t forget to hit the Boost button 🚀 if you found this helpful!
---
Disclaimer: Financial markets are subject to high risk. This is not financial advice – please do your own research (DYOR) and trade responsibly.
