Trading opportunity for DOTUSDTBased on technical factors there is a Buy position in :
📊 DOTUSDT
🔵 Buy Now
🪫Stop loss 3.570
🔋Target 5.300
📏 R/R 2,5
💸RISK : 1%
We hope it is profitable for you ❤️
Please support our activity with your likes👍 and comments📝
DOTUST trade ideas

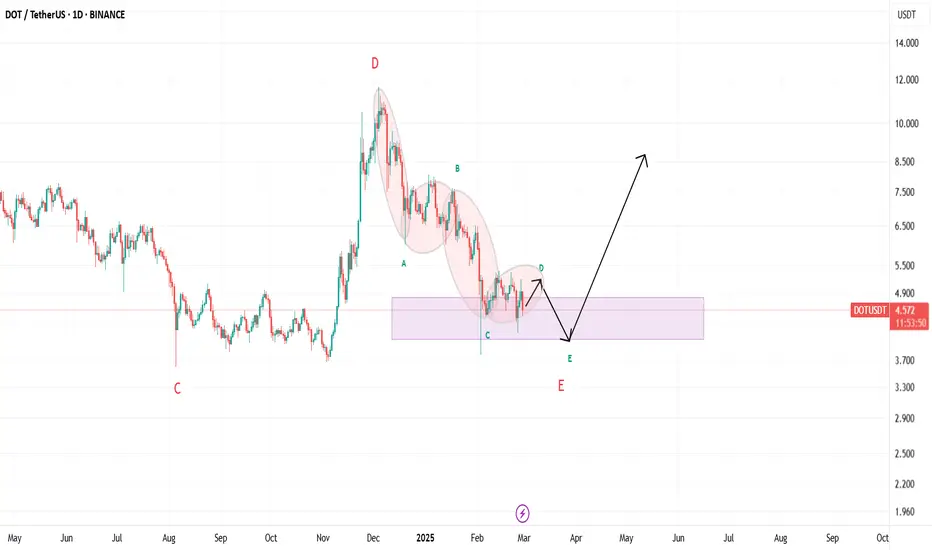
My personal analysis of the DOT cryptocurrency from an Elliott WIn my opinion, the DOT cryptocurrency is completing wave D in the form of a triangle to complete the larger E wave. For this purpose, after completing wave D, we will have a small one that looks like a triangle completing a E wave, and after that we can see the width of the DOT grow.
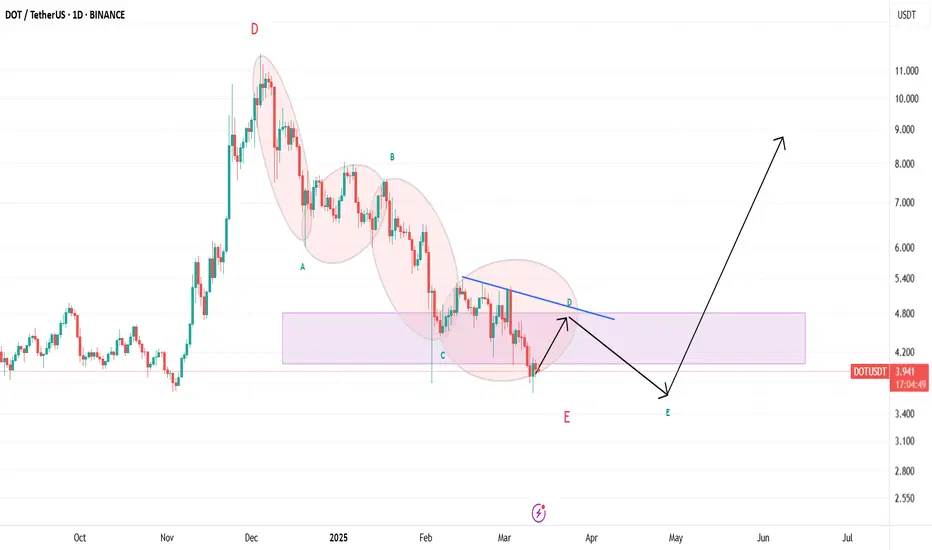
Review of the DOT cryptocurrency from an Elliott Wave perspectivIn conclusion, in conclusion to the previous analysis from an Elliott wave perspective, I think the D wave is not yet complete and needs another branch, and after that we could see a one-wave E wave down, and after that a low-risk area for buying is considered.
PolkaDot DOT Has a Chance, But Still In Danger!Hello, Skyrexians!
Recently we have already made analysis on BINANCE:DOTUSDT before the dump, where pointed out that wave 5 to the downside ahead. Asset has finally reached the minimal target at $3.8 and now we have a question if it's going to reverse or $2 is next.
Let's take a look at the daily time frame. We can see the Elliott waves structure and wave 5 can be finished anytime now. Our best practice to find the reversals is the green dot on the Bullish/Bearish Reversal Bar Indicator and the divergence with Awesome Oscillator. Now we can see all these conditions, but bullish reversal bar is still unconfirmed, while it's high is going to be broken, the danger will be melted, but now we still have a chance to go down.
Also wanna notice the false signals on the indicator. All of them are placed inside the range and cannot be counted as valid. Take it into account when use it.
Best regards,
Skyrexio Team
___________________________________________________________
Please, boost this article and subscribe our page if you like analysis!

Polkadot trade update! (At point of execution)BYBIT:DOTUSDT.P
Going back to my polkadot interest on the 7th of march i was saying that i would be sleeping on this until it got to my point of execution... at this point im putting a limit order in for a 1:6 on the 15M.
If you go back to my last post on polkadot (should be linked to this one) you will see my circled points of support, I was able to set this trade up with both of them major support levels with my stop loss below both.
Now its set and forget. This trade is COMPLETE
Win or Lose! IM HERE
Thanks guys

DOT 10x Possibility Very SoonHello once again friends,
Here's a coin that I'll long for a nice 10X from the lows.
Make sure to scoop some out, because its a solid project.
Trade thirsty!

DOTUSDT 1WDOT ~ 1W Analysis
#DOT The lowest support that needs to be maintained, or this coin will experience further decline.

Polkadot (DOT): Good Spot Gem!Polkadot is one hidden gem for spot holdings. Price is way below it's potential zones so let's take a deeper look into it!
More in-depth info is in the video—enjoy!
Swallow Team

Dotusdt short to $4.00 !!Okay so I just now opened a short trade on DOt USDT.
DTT strategy applied .
Anticipating an aggressive impulse break-down soon. Maybe later today or tomorrow.
Target is set to $4.000
Maybe I take partials along the way...maybe I don't depends on the price action.


Alert: polkadot on a bullish talkOn the weekly chart we can see that polka dot touches four times the heaviest support
It is certainly that the price going go up reaching the three tips
1- $7 (💯💪)
2- $11 (💯💪)
3- 24 (50% if polka dot on the reserve strategy and the ETF has been approved it will be 💯 💪)
Expect a positive news for polka dot as they are also launching polkadot 2.0

Dot is try to rebound from support.CRYPTOCAP:DOT : This is how PolkaDot chart look like...
No doubt project give frustration to holder. But $4 look good buy.
Resistance $.530
Support : 3$3.50
Price start jump from support after rumor of DOT ETF.
Yes eye on BTC, with out positive sentiment it will trade in range $4 to $5.30

DOTUSDT at a Make-or-Break Level – Big Move Incoming?Yello, Paradisers! Is DOTUSDT on the verge of a breakout, or will the bears crush the momentum? Read on this is a critical moment!
💎#DOTUSDT is showing strong bullish momentum, bouncing off the demand zone above $4.582, signaling that buyers are stepping in and defending key levels. The market structure remains favorable for the bulls, but a crucial test is ahead.
💎The price is trading above both the 50 EMA and the 200 EMA, which is a strong indication that the uptrend is intact. Volume is increasing near demand zones, suggesting that buyers are actively supporting the price. This reinforces the strength of the trend, with green candles showing a strong buying push and minimal wicks, indicating low selling pressure.
💎If POLKADOT successfully breaks and holds above $5.00 with strong volume, the next upside target is $5.30, a major resistance zone. A decisive breakout here could open the door for an even stronger rally. However, if DOT fails to break $5.00 and retraces, the lower demand zone at $4.465 will be a key area to watch for a potential bullish rebound. A close below $4.215 would invalidate the bullish setup and shift momentum in favor of the bears.
Patience is key, Paradisers! If we see a confirmed breakout, we act. If not, we wait. Discipline is what separates traders from gamblers. Stay sharp and trade smart! 🎖
MyCryptoParadise
iFeel the success 🌴

#DOT/USDT Looking for a move up if we break out#DOT/USDT has found support at the midline of the descending channel formation on the two hours update.
Looks bullish📈

DOT/USDT looking for a move up if we break out#DOT/usdt has found support at the midline of the descending channel formation on the two hours update 🔍

Polkadot trade brewing...BYBIT:DOTUSDT.P
Currently looking for some new setups and i think we can squeeze a 3rd spike from this level here... i like the volatility so im just going to sleep on this and ill touch base in the morning.
As you can see i circled the last 2 spikes for you guys.
Alert set at 3.906

Polkadot 8X Trade-Numbers (6,280% Potential)One is theory, the other one is practice.
One is the analysis and the other one the numbers.
Technical analysis and trading numbers.
Here we go again with Polkadot (DOTUSDT). This time around we are not focusing on the analysis but the full trade-numbers for a leveraged trade. Still, let's consider the chart briefly and what it has to say.
The black lines... Previously, the black lines showed the drop and the incoming bear-market. High prices and All-Time High = bearish. A long-term double-top, the highest ever, led to the strongest ever bear-market.
Now, the black lines signal support. The market bottom. All-Time Lows and bottom prices = bullish. A long-term accumulation phase with higher lows will kick off the next bullish market. We are in, we are live and we are green.
The market moves in cycles and within this cycles we have waves...
We are going from a neutral, sideways market to a bullish market. The neutral sideways market produces the same highs and the same lows. The bullish market will produce higher highs and higher lows. This is were we are going next.
Notice that we use lower targets for the leveraged trades compared to spot trades. This is because leverage carries higher risk. We are happy with a win and with big profits but not greedy. In this market, greed will get you killed. Financially speaking.
Full trade-numbers below:
____
LONG DOTUSDT
Leverage: 8X
Entry levels:
1) $4.60
2) $4.30
3) $4.40
Targets:
1) $4.92
2) $5.62
3) $6.77
4) $7.70
5) $8.63
6) $9.96
7) $11.6
8) $14.66
9) $16.52
10) $19.53
11) $21.68
12) $24.41
13) $32.30
14) $40.19
Stop-loss:
Close weekly below $4.00
Potential profits: 6280%
Capital allocation: 4%
____
Disclaimer: I love you and I am deeply grateful for your continued support.
You are a diving human being, you can do whatever you want.
It is your life, it is your body, it is your money, it is your soul.
Trade, drink, eat, sleep; it is your choice.
Namaste.

DOT BUYhello friends
According to the pullback we had, we can enter into the transaction with risk and capital management.
*Trade safely with us*

Something happens!! If CRYPTOCAP:DOT application for TSXV:ETF got APPROVED + IF #dot has a spot between CRYPTOCAP:BTC CRYPTOCAP:ETH CRYPTOCAP:ADA CRYPTOCAP:SOL CRYPTOCAP:XRP for the strategic crypto reserve that going to be on Friday
This coin will explode to 30$ in 1h
Keep an eye on this project

DOT Can We Expect a Similar Bounce?
CRYPTOCAP:DOT If the price holds the current support, we could see another leg up towards $8.3 - $11.6, similar to past price movements.
If the support breaks clearly, further downside could be expected, but so far, the bullish scenario remains dominant.
🔹 Conclusion: We are closely monitoring the $3.562 support level. If strong reversal signals appear, this could be an ideal buying opportunity, aiming for another rally like the previous ones! 🎯🚀

DOT Reaching Oversold Levels – Buy the Dip?DOT/USDT is currently trading within a well-defined range, with a key support zone around $3.50 - $4.00 and a major resistance zone near $10 - $11. The price has bounced multiple times from support and faced repeated rejections at resistance, highlighting a strong consolidation phase.
The Stochastic RSI is oversold, indicating that a potential reversal from support could be in play. If buyers step in at this level, DOT may attempt another move toward the resistance zone.
DYOR, NFA

#DOT/USDT#DOT
The price is moving in a descending channel on the 1-hour frame and is expected to continue upwards
We have a trend to stabilize above the moving average 100 again
We have a descending trend on the RSI indicator that supports the rise by breaking it upwards
We have a support area at the lower limit of the channel at a price of 4.50
Entry price 4.60
First target 4.72
Second target 4.85
Third target 4.99

DOT’s Discount Zone Could Fuel the Next Big Move
The BINANCE:DOTUSDT chart is trading within a key accumulation and discount zone, making this a critical level for long-term positioning. Historically, this area has acted as a strong support, suggesting that it could be an optimal entry point before a potential upward move.
The support zone around $4.37 has been tested multiple times, reinforcing its significance. If buyers step in at this level, the projected upside targets stand at $11.80 (+140%) and $23.06 (+350%), offering substantial profit potential.
The EMA ribbon reflects the ongoing consolidation, confirming that the price is still within a structural range. Given this, entering near the lower boundary of the channel increases the likelihood of a successful trade, aligning with historical reactions at this level.
👨🏻💻💭 Will DOT continue accumulating at this key support before making a big move, or are we in for a deeper correction? Share your thoughts and let’s analyze the setup together!
__
The information and publications within the 3Commas TradingView account are not meant to be and do not constitute financial, investment, trading, or other types of advice or recommendations supplied or endorsed by 3Commas and any of the parties acting on behalf of 3Commas, including its employees, contractors, ambassadors, etc.
