DASH Has a Once In A Lifetime SetupThe Dash chart is in a multi-year correction, however the price action remains strong. It is a great place to start accumulating coins for a major bull run.
DSHUSD trade ideas


DASH, short-term bearishThe following content is machine translated:
In the 4-hour chart, the short-term trend is currently showing a correction, and the lower support is near the rising trend line.
The indicator macd is about to die, and the RSI indicator is trending downward and will reach the neutral 50.
Summary: The pattern trend is bearish and the indicator trend is bearish. Now you can go short, pay attention to the support of the rising trend line below, the support is effective to take profit, and the fall below the support is further bearish.

DASH.USD P-Modeling Pt X1. The Blank Canvas of CajunWelcome Hyperspace Travelers,
Time to enter the next stage of the experiment.
The Blank Canvas of Cajun.
Cycle 1.
Thanks for Pondering the Unknown with Me,
Glitch420

DASH USDT SHORT SWING | DASHUSDT | SHORT @ 51 - 49 | TP @ 48, 47, 46, 45, 44 | SL @ 55 | PATTERN = TRIPLE BOTTOM BREAKDOWN | BINANCE |
Swing trade idea. Kindly follow targets and stop loss. Will update with new targets once all 5 are achieved. Mostly trading with PNF charts, MACD, RSI, Stoch, BPI, Cipher, MA/EMA, Support/Resistance on hourly timeframes and higher time frames
BINANCE:DASHUSDT BINANCE:DASHUSD COINBASE:DASHUSD BYBIT:DASHUSDT KUCOIN:DASHUSDT FTX:DASHPERP BINANCE:DASHUSDTPERP

#week08assignment #RafayLong position taken after observing price action at bullish pennant pattern.

Dash looks like this on 1 Day!Dash looks like this on 1 Day!
Agree?
TA works nice on 1h, 4h, 1D timeframes!

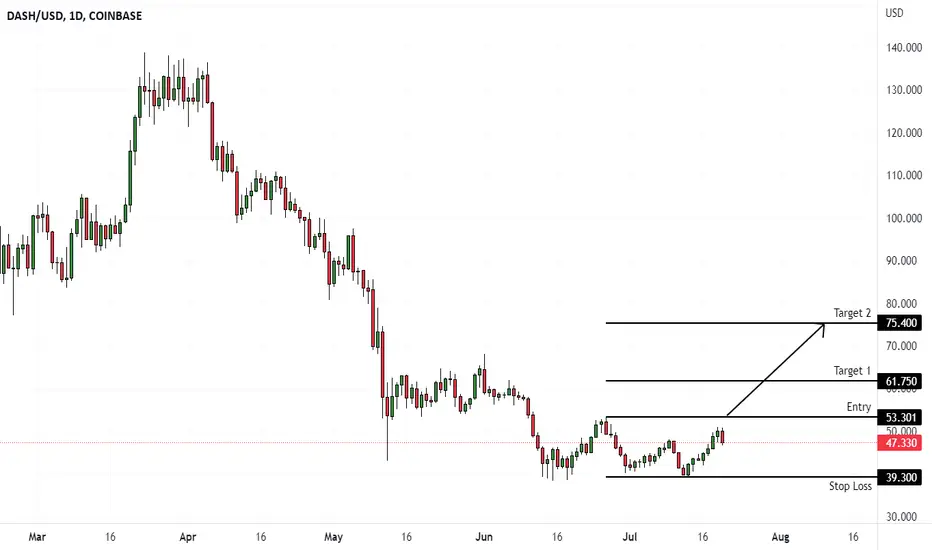
DASHUSD (Daily) Bullish reversalHi Traders
DASHUSD (Daily Timeframe)
Waiting for the upward break of 53.30 resistance level, which will complete a bullish trend reversal pattern to go LONG. Only the downward break of 39.30 would cancel the bullish scenario.
Trade details
Entry: 53.30
Stop loss: 39.30
Take profit 1: 61.75
Take profit 2: 75.40
Score: 5
Strategy: Bullish reversal
DASHUSD AnalysisA long term view for DASH
The previous break out was due to a relatively large ascending triangle
The top resistance of this pattern can be used for a following pattern of a symmetrical triangle, which is much larger and yet to break out
Similar top points above the hammer
Both patterns are bullish
Daily timeframe

DASHA measured move on DASH break out is $70 & ETH is the yellow comparison & wants dash at $54 right now. Should play nice with BTC close to breaking $22k.

Accumulation...Crypto going to enter a phase where coins with utility/max supply end up being very valuable - Think Bch/Ltc/Zec/Etc and ofc Dash.

DASH/USDHello traders. Here he have present a well known triangle pattern. The supoort was tested many times taking liquidity from it as each time after the price takes liquidity the pumps are smaller. Let's wait and see if the support breaks. On the other hand if the trend breaks the price will just return to its distribution zone ( see ETH example). This type of pattern is very tradable... good luck stay sharp!

DASH USD : FALLING WEDGE MACRO REVERSAL BREAKOUT! GET READY!FOLLOW, LIKE, AND COMMENT IF YOU APPRECIATE THIS CONTENT. THANK YOU
DASH has been correcting and consolidating for a while now. The correction is over in my opinion and DASH will soon reverse course and shoot to the upside. The measured target of the break of the wedge brings DASH to $250-$300 and then usually these runs continue after the break and initial target is reached. We can revisit that at that time around $250-$300 to see what indicators are telling us on whether DASH will continue or correct. I am of the opinion that DASH will continue its uptrend after the break. Good luck out there. This is not financial or trading advice this is just my opinion. Thank you

DASH cryptoDash view:
- Expecting start 3w on smaller degree and dump to ~30$ as all markets goes down in coming days / weeks.
- This will finish in ~25$ area and bounce back to ~60$ to finish w4 on larger degree as all markets recovers, this recovery will last for few months.
- After recovery we go down for final wave.
I will buy in ~25$ as opportunity presented itself and buy more on that last wave if everything plays out as expected.
I believe huge opportunity is coming very soon.
Thank you !


DASH/USDhi. hope my ideas can help you guys
here is DASH US DOLLAR, the SHORT senario is ON
the price is going to pull back to 44.55, kiss it and go to the main target at 34.769

About DASHUSDhi everybody.this what i think about DASHUSD with two senarios of increase and decrease

DASHUSD (4H) Bullish reversalHi Traders
DASHUSD (4H Timeframe)
Waiting for the upward break of 46.35 resistance level, which will complete a bullish trend reversal pattern to go LONG. Only the downward break of 38.50 would cancel the bullish scenario.
Trade details
Entry: 46.35
Stop loss: 38.50
Take profit 1: 51.18
Take profit 2: 59.00
Score: 4
Strategy: Bullish reversal

DASHUSD (4H) Bearish Wave We2Hi Traders
DASHUSD (4H Timeframe)
A Medium-high probability, entry signal to go SHORT will be given with the downward break of 41.350after the market found resistance at 46.30. Only the upward break of 46.30 would cancel the bearish scenario.
Trade details
Entry: 41.35
Stop loss: 46.30
Take profit 1: 33.40
Take profit 2: 28.15
Score: 7
Strategy: Bearish Wave We2

Dash Working on Dash... Should be great opportunity to buy very soon.
It looks like DASH from 20$ to 5k

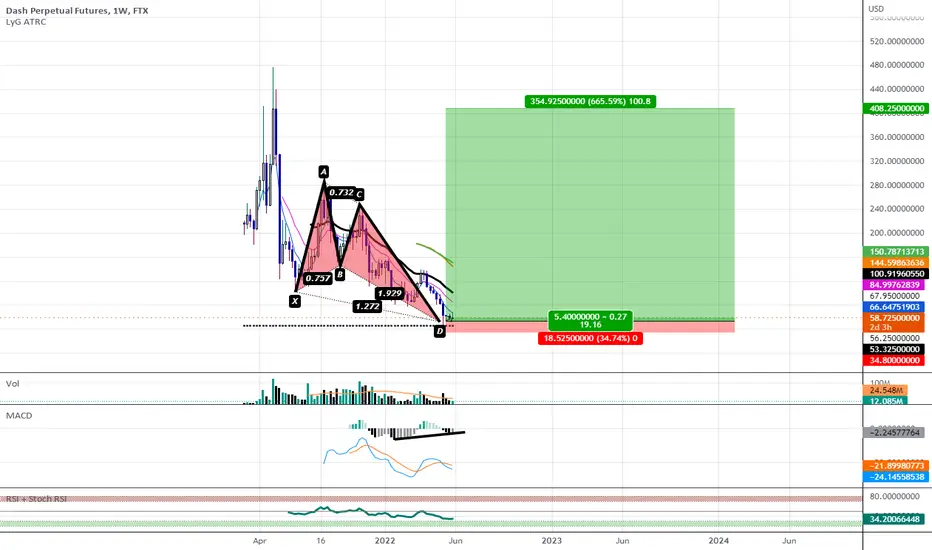
Bullish Butterfly with Bullish Divergence on WeeklyWe Have Weekly MACD Bullish Divergence Visible at the PCZ of a Bullish Butterfly on DASH
DASH, breaking range resistance.The following content is machine translation:
In the 4-hour chart, this rebound fluctuated in the 54-64 support and resistance range. There are signs of breaking through the range resistance today, which is bullish.
The fast and slow line of the indicator macd runs above the zero axis, and it is dominated by more. The current energy column is weak, which may bring a small step back. The RSI indicator is currently weak on the edge of overbought, and may fall back slightly to adjust, and the general direction is bullish.
In operation, the market breaks through the resistance of the range and is bullish. The indicator is weak in the uptrend and lacks kinetic energy. It may slightly step back and adjust, and then continue to uptrend and be bullish. Step back to stabilize and do more, the upper target is near $78.

as expected
dash broke through the descending channel and then stepped back to rise
At present, the short-term bulls still have the advantage
We recommended it a few days ago
you can keep holding it
Follow me to take you to achieve financial freedom
