DUSKBTC hits support of Wedge and formed harmonic for breakoutThe price action of Dusk / Bitcoin has hit the support of the wedge and also hit at lower bands of Bollinger bands and now turning bullish to hit the resistance again.
All indicators are turning bullish.
The moving average convergence divergence indicators is giving bull signals by turning weak bearish from strong bearish.
Stochastic has also given bull cross from the oversold zone which is very strong bullish signal.
And if we see the directional movement then it can be clearly seen that the ADX which was previously assigned to –DI (-DI is the line which represents the bears) is down now and +DI (+DI is the line which represents the bulls) has crossed up the –DI and it is another strong bullish confirmation.
And the most strongest signal which can lead even the price action to breakout the resistance of this wedge is the formation of bullish BAT inside this wedge and the price action has taken bullish divergence from the potential reversal zone of this bullish harmonic BAT pattern:
Now we can set our sell targets between Fibonacci projection area of tail to support of this wedge between 0.382 to 0.786 Fibonacci as below:
Sell between: 0.00000662 to 0.00000850.
So if we buy even here then this trade has potential to take 50% bullish move.
Regards,
Atif Akbar (moon333)
DUSKBTC trade ideas


DUSKBTC - alternate Bat patternWatch for entry on break-out of the falling wedge. This pattern looks pretty good and there is big propability for trend reversal. Possible positions are on the chart.
Good luck

Update: The CLEAREST chart in historyAn update for our signal which earned us +20%. What comes next, after we had successfully predicted the reversal?
DUSK/BTC has fallen back to a state of relative compression. Periods of 200, 100 and 55 are regressing below the necessary level of 0.7 on the WAVE-PM indicator, but still need time to do so.
14-day volatility characterized by the orange oscillator is below critical levels, and therefore has enough potential to produce a short-term movement in the following days.
Its target could be the 200 MA on the 1H chart, or similarly the 50 MA on the 4H chart (turquoise color). As this is a more risky signal, we DON'T recommend taking it without setting tight stop-losses and doing your own research first.
For the rest of the compression, the price should remain inside the 50 MA Bollinger Band on the daily chart, which is currently at the levels of 537 (lower band) and 667 (upper band). These are the relative highs-and-lows, and a movement on either side should be stopped by them until enough volatility ceases to be and a new trend begins. Please, use the displayed purple band for an approximate reference.
Commodity Channel Index, custom volatility indicators and Bollinger Bands and their derivatives were used in the technical analysis. This is not a financial advice and you agree to take 100% responsibility.
Follow @MeowSignals for more insights! Also make sure to visit our...
Facebook: www.facebook.com
Website: (coming soon)


DUSK.... We can see some bullish waveshigh risk trade therefore manage your money wisely ...good luck

DISCIPLINE is the real reason why you lost money on this chartIt is only necessary to come back to DUSK/BTC and explain why many retail traders don't make money on daily basis: it is because they lack discipline .
So, what has happened here? Why has the supposedly "golden secret" of trading failed? That's because it hasn't failed. You have. The first standard deviation marks two conditions:
Trending - price is trading outside the 1st standard deviation. Trend is friend.
Not-Trending - price is trading inside the 1st standard deviation. Return to the mean is inbound with 90% accuracy.
These statistics are among the highest and most reliable in trading. And yet, people have been accusal, because they still managed to lose money. Why is that? Because they lack discipline. Setting stop losses should be your number one priority in risk management. When the price leaves the 1st standard deviation, and therefore the market condition of not-trending is broken, you should already be out of the market. When the price re-enters the 1st standard deviation, so should you.
Many retail strategies look as following: small win, small win, small win, and then BIG loss. I make consistent results, but only because I learned to be disciplined and know my strategy works the other way around: small loss, small loss, and eventually BIG win. If you had set stop losses, you would have lost only about 3.5%. And guess what? You would already be making more money by re-entering the chart!
The current pivot and the target is the 0.618 Fibonacci Retracement, corresponding with the upper 200 4H Bollinger Band and soon to be the 50 moving average.
Commodity Channel Index, custom volatility indicators and Bollinger Bands and their derivatives were used in the technical analysis. This is not a financial advice and you agree to take 100% responsibility.
Follow @MeowSignals for more insights! Also make sure to visit our...
Facebook: www.facebook.com
Website: (coming soon)

The CLEAREST chart in historyDUSK/BTC's upward movement is at halt as the price enters the 1.25 standard deviation of the 50 4H SMA Bollinger Band. A confirmation is most likely inbound (price tagging the band from the inside).
The price is headed to two main levels:
50 SMA - also the 0.5 Fibonnaci Retracement
200 SMA - also the 0.618 Fibonnaci Retracement
Commodity Channel Index, custom volatility indicators and Bollinger Bands and their derivatives were used in the technical analysis.
Follow @MeowSignals for more insights! Also make sure to visit our...
Facebook: www.facebook.com
Website: (coming soon)

$DUSK : Falling KnifeCross over : support zone / ascending trendline
Tight SL
Not a Financial Advice

Upside Potential Expecting a move higher here which should push up somewhere in our box marked it can overshoot it but for now this is the area I see us rallying to, support marked does not invalidate the bullish move but it probably should not be busted either in that respect so keep an eye on it.

DUSK LONG$DUSK
Reclaimed an important level as support (700). I think we'll get a move up to test 825 from here; invalidation on a close beneath 700.

DUSK/BTC TA Update (Daily Trend Change?)DUSK/BTC
Dusk finally broke the down-line resistance and 50 Day MA. Made a Higher High and Higher Low, a potential daily trend change is on the way.
We need a healthy pullback to the previous resistance to turn into new support. I have highlighted in the chart where we can expect a bounce.

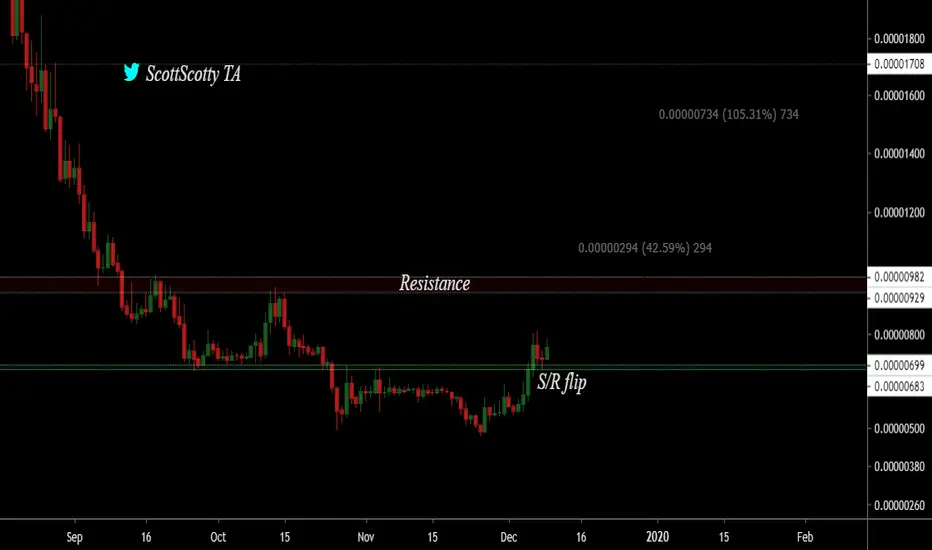
$DUSK, Pushing against ~700sats resistance level w volume..$DUSK
Pushing against ~700sats resistance level with increasing volume
Mainnet Launch coming on December end
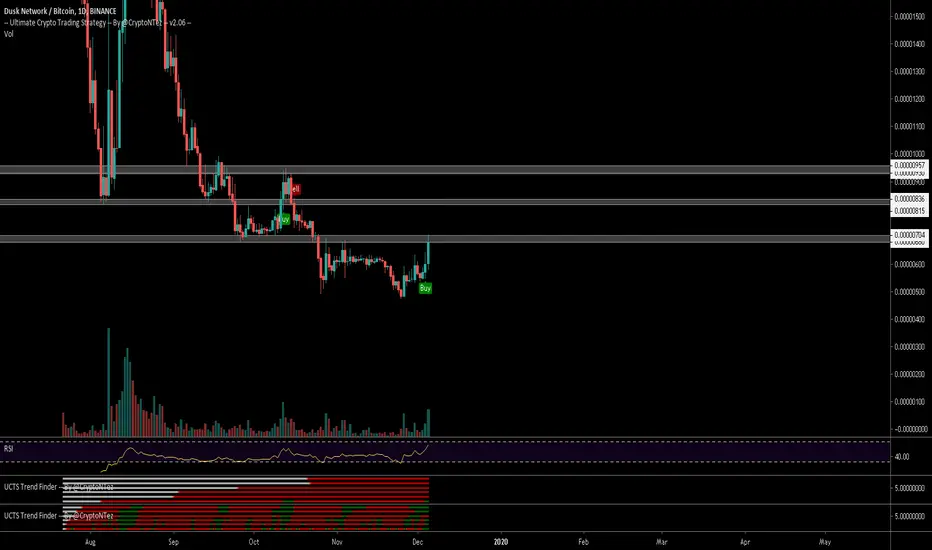
UCTS Buy signal on the 1D chart.
RSI moving quickly to bullish levels.
Wait for a flip of this level for a potential entry..
If happens aiming for 815/950 sats
#DUSK
Dusk Network Volume Starts To Grow | 265%+ TargetHere is the full chart for Dusk Network (DUSKBTC):
Trading volume is now starting to grow and EMA50 has been broken... What this means is that DUSKBTC can easily move higher after trading day closes, hitting EMA100 (0.00000849) easy next, it would only take a few days.
The chart is looking good and Dusk Network can easily start to grow from here... Thanks a lot for your support.
Namaste.


DUSK - im changing trend direction .attention to all passengersDUSK - im changing trend direction .attention to all passengers , next fly is only up ...

Dusk Network (Nov 30) 46% PProfit in 12 Days#DUSK/BTC (Binance)
Entry Zone: 535 - 550
Take Profits: 600 - 650 - 700 - 750 - 800 -900
Stop Loss: 515

DUSK/BTC | Wedge Breakout..!!DUSK/BTC (Binance)
Falling Wedge Breakout Done in Daily Chart With Strong Buying Volume ..
Printing RSI & MACD Bullish Divergence as Well in Daily Timeframe .
But Need More Volume For Healthy Uptrend..
590 Sats is the Major Resistance..!!
Please, give us your opinion in the comments.!!
If you like the idea, please hit the Like button and subscribe to the profile in order not to miss our updates.
The information given is never financial advice. Always do your own research.
FREE Telegram channel t.me
Follow me on Twitter twitter.com
