DYDX Breakout from Falling Wedge | Targeting $1.60+# DYDX Breakout from Falling Wedge | Targeting $1.60+
📈 **DYDX/USDT Analysis – Daily Timeframe**
DYDX has just broken out of a falling wedge pattern – a classic bullish reversal formation – after holding a strong support zone around **$0.50**. This zone has acted as a reliable demand area for seve

DYDXUSDT 12H#DYDX is moving inside a descending channel on the 12H chart.
In case of a breakout above the channel resistance and the Ichimoku Cloud, the targets are:
🎯 $0.5836
🎯 $0.6237
🎯 $0.6808
🎯 $0.7536
⚠️ As always, use a tight stop-loss and apply proper risk management.

#DyDx Superb opportunity#DYDX
The price is moving within a descending channel on the 1-hour frame, adhering well to it, and is on its way to breaking it strongly upwards and retesting it.
We have a bounce from the lower boundary of the descending channel. This support is at 0.470.
We have a downtrend on the RSI indicato


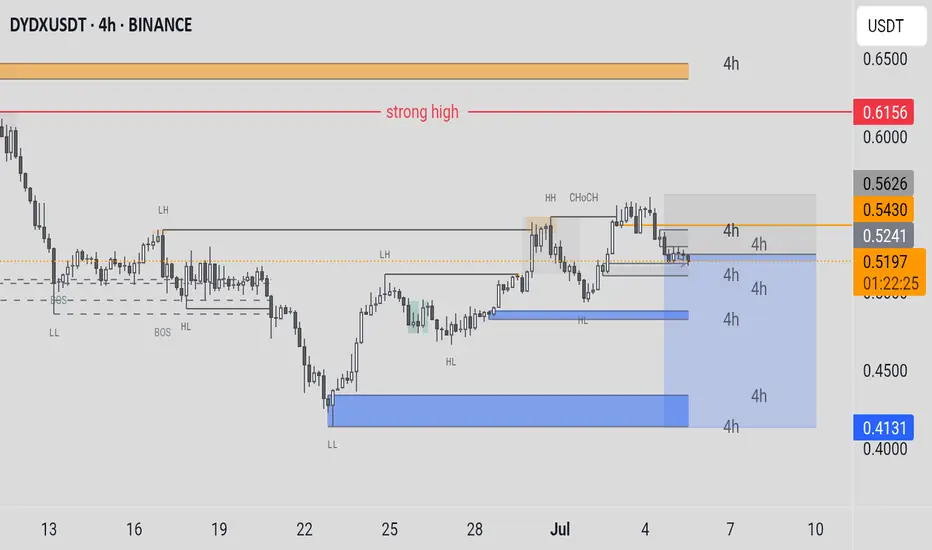
DYDXUSDT Price Levels: The current price is around 0.6030 USDT. The chart highlights a "strong high" resistance level near 0.5626, with higher highs (HH) and change of character (CHOCH) noted recently.Support and Resistance:Support zones are marked around 0.5199, 0.5253, and a lower support (HL) around 0.450
7-star short update -we have received a short signal on DYDX. Short signal on 7-star is finding the top most eligible reversal point. so far so good. Expecting the target
For indicator access, you can contact me
D Y O R
Indicators only tell what happened to the market and should be used with utmost caution but the

DYDXUSDT Cryptocurrency Futures Market Disclaimer 🚨🚨🚨
Trading cryptocurrency futures involves high risks and is not suitable for all investors.
Cryptocurrency prices are highly volatile, which can lead to significant gains or losses in a short period.
Before engaging in crypto futures trading, consider you
DYDXUSDTCryptocurrency Futures Market Disclaimer 🚨🚨🚨
Trading cryptocurrency futures involves high risks and is not suitable for all investors.
Cryptocurrency prices are highly volatile, which can lead to significant gains or losses in a short period.
Before engaging in crypto futures trading, consider you


See all ideas
Summarizing what the indicators are suggesting.
Oscillators
Neutral
SellBuy
Strong sellStrong buy
Strong sellSellNeutralBuyStrong buy
Oscillators
Neutral
SellBuy
Strong sellStrong buy
Strong sellSellNeutralBuyStrong buy
Summary
Neutral
SellBuy
Strong sellStrong buy
Strong sellSellNeutralBuyStrong buy
Summary
Neutral
SellBuy
Strong sellStrong buy
Strong sellSellNeutralBuyStrong buy
Summary
Neutral
SellBuy
Strong sellStrong buy
Strong sellSellNeutralBuyStrong buy
Moving Averages
Neutral
SellBuy
Strong sellStrong buy
Strong sellSellNeutralBuyStrong buy
Moving Averages
Neutral
SellBuy
Strong sellStrong buy
Strong sellSellNeutralBuyStrong buy
Displays a symbol's price movements over previous years to identify recurring trends.