DYDX Breakout from Falling Wedge | Targeting $1.60+# DYDX Breakout from Falling Wedge | Targeting $1.60+
📈 **DYDX/USDT Analysis – Daily Timeframe**
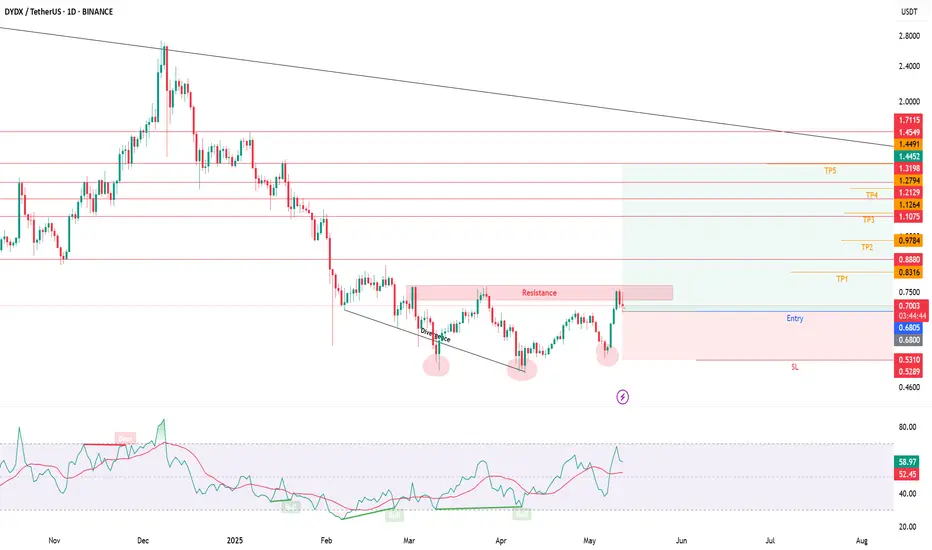
DYDX has just broken out of a falling wedge pattern – a classic bullish reversal formation – after holding a strong support zone around **$0.50**. This zone has acted as a reliable demand area for several months.
---
🔍 **Technical Highlights:**
- ✅ Falling wedge breakout confirmed with daily candle close above resistance
- 🟢 Strong support at $0.50–$0.52
- ⚠️ Horizontal resistance at $0.75 may act as a short-term barrier
- 🚀 Potential rally toward major resistance at **$1.60–$1.70** (target zone)
---
🎯 **Profit Targets:**
- First Target: **$0.75**
- Final Target: **$1.60 – $1.70**
❌ **Invalidation (Stop-loss idea):**
- If price breaks below $0.48 with volume, the bullish scenario may be invalidated.
---
📊 This setup is based on breakout structure and potential trend reversal. If volume confirms, this could be the beginning of a new mid-term uptrend.
💬 Let me know what you think about this setup! Would love to hear your feedback.
DYDXUSDT trade ideas

dYdX Hyper Bullish Market Conditions, $11.1 Next Target (1,671%)"Once we hit bottom, there is no other place left to go but up." dYdX hit bottom, a new all-time low last month and is turning ultra-hyper bullish this week. The action is already moving above EMA8 and EMA13 while breaking a local downtrend coming off the December 2024 peak price.
We have a full green candle and this candle signals a recovery and the start of the 2025 bull market cycle. This cycle can last 6-12 months for this specific pair or longer. Remember that each project, each trading pair, each altcoin can produce different price patterns and dynamics. This is easy to see because here we have a new all-time low, other pairs hit their all-time low in April this same year while others did so in August 2024, others in 2023, some others in 2022, etc. Each pair/project should be considered individually.
Good strong projects trading at bottom prices have higher potential for growth. For example, you can certainly make more money buying and holding dYdX tokens vs Solana or Ethereum. Because the latter two are trading much higher compared to their all-time high and because these projects are much bigger. Smaller projects have higher potential for growth.
So all is good in Crypto-world the market is going up. dYdX is turning bullish just now but the bias is confirmed based on marketwide action. Seeing how the other projects are performing predicts what comes next. When the week closes above EMA8 and EMA13, you have a full blown bullish confirmation. The action already recovered from the ATL range and is happening above the 10-March and 7-April lows. This is enough to secure/confirm growth.
We buy low to sell high. We buy when the market is red and hold.
We sell when prices are high. We sell when the market is green and there is lots of hype all around. Lots of profits to be made. At this point in time, all that is needed is to choose wisely and practice patience, patience will be the biggest earner; patience pays.
Thank you for reading.
Namaste.

#DyDx Superb opportunity#DYDX
The price is moving within a descending channel on the 1-hour frame, adhering well to it, and is on its way to breaking it strongly upwards and retesting it.
We have a bounce from the lower boundary of the descending channel. This support is at 0.470.
We have a downtrend on the RSI indicator that is about to be broken and retested, supporting the upside.
There is a major support area in green at 0.445, which represents a strong basis for the upside.
Don't forget a simple thing: ease and capital.
When you reach the first target, save some money and then change your stop-loss order to an entry order.
For inquiries, please leave a comment.
We have a trend to hold above the 100 Moving Average.
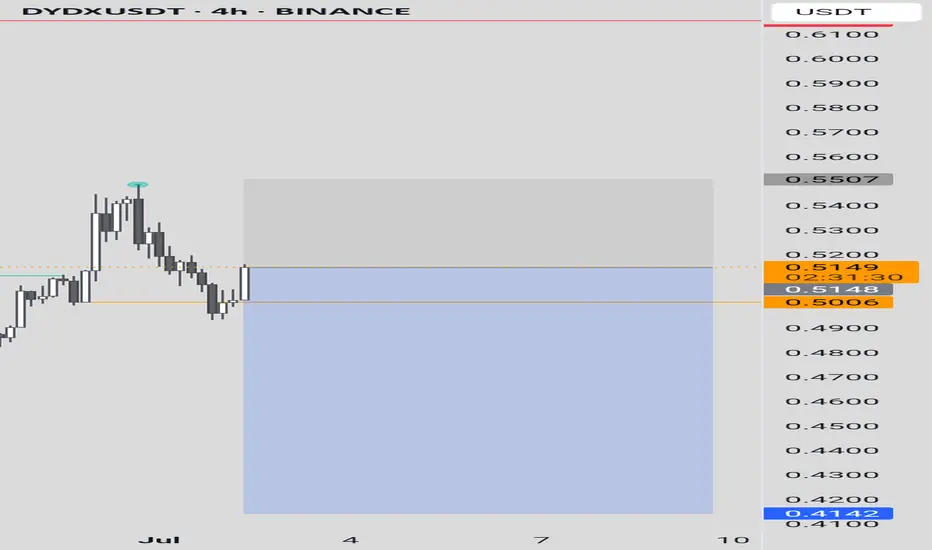
Entry price: 0.500.
First target: 0.522.
Second target: 0.537.
Third target: 0.559.
Don't forget a simple thing: ease and capital.
When you reach your first target, save some money and then change your stop-loss order to an entry order.
For inquiries, please leave a comment.
Thank you.

DYDXUSDT 12H#DYDX is moving inside a descending channel on the 12H chart.
In case of a breakout above the channel resistance and the Ichimoku Cloud, the targets are:
🎯 $0.5836
🎯 $0.6237
🎯 $0.6808
🎯 $0.7536
⚠️ As always, use a tight stop-loss and apply proper risk management.

DYDXUSDT UPDATE
Pattern: Falling Channel Breakout
Current Price: \$0.6246
Target Price: \$0.90
Target % Gain: 60.10%
Technical Analysis: DYDX has broken out of a falling channel on the 12H chart, with strong bullish candles and volume confirming the breakout. A successful retest can validate the move towards the target.
Time Frame: 12H

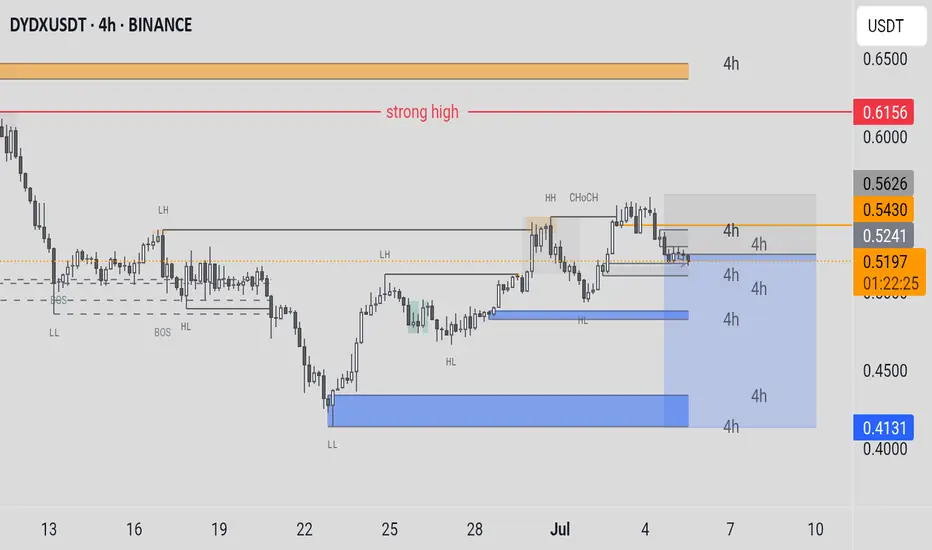
DYDXUSDT Price Levels: The current price is around 0.6030 USDT. The chart highlights a "strong high" resistance level near 0.5626, with higher highs (HH) and change of character (CHOCH) noted recently.Support and Resistance:Support zones are marked around 0.5199, 0.5253, and a lower support (HL) around 0.4500.Resistance is indicated near the "strong high" and higher levels up to 0.5626.Trends: The price recently broke above a previous high (LH) and formed a higher high, suggesting bullish momentum. However, it’s approaching a resistance zone.Volume and Patterns: The chart includes annotations like "BOS HL" (Break of Structure Higher Low), indicating a potential shift in trend.
Cryptocurrency Futures Market Disclaimer 🚨🚨🚨
Trading cryptocurrency futures involves high risks and is not suitable for all investors.
Cryptocurrency prices are highly volatile, which can lead to significant gains or losses in a short period.
Before engaging in crypto futures trading, consider your risk tolerance, experience, and financial situation.
Risk of Loss: You may lose more than your initial capital due to the leveraged nature of futures. You are fully responsible for any losses incurred.
Market Volatility: Crypto prices can fluctuate significantly due to factors such as market sentiment, regulations, or unforeseen events.
Leverage Risk: The use of leverage can amplify profits but also increases the risk of total loss.
Regulatory Uncertainty: Regulations related to cryptocurrencies vary by jurisdiction and may change, affecting the value or legality of trading.
Technical Risks: Platform disruptions, hacking, or technical issues may result in losses.
This information is not financial, investment, or trading advice. Consult a professional financial advisor before making decisions. We are not liable for any losses or damages arising from cryptocurrency futures trading.
Note: Ensure compliance with local regulations regarding cryptocurrency trading in your region.
thanks for like and follow @ydnldn to have more information outlook and free signal.
About me :
"I am a passionate swing trader focused on analyzing financial markets to capture profit opportunities from medium-term price movements. With a disciplined approach and in-depth technical analysis, I concentrate on identifying trends, support-resistance levels, and price patterns to make informed trading decisions. I prioritize strict risk management to protect capital while maximizing profit potential. Always learning and adapting to market dynamics, I enjoy the process of refining strategies to achieve consistency in trading."
7-star short update -we have received a short signal on DYDX. Short signal on 7-star is finding the top most eligible reversal point. so far so good. Expecting the target
For indicator access, you can contact me
D Y O R
Indicators only tell what happened to the market and should be used with utmost caution but they are good catalysts for entering a trade with stoploss

DYDXUSDT Cryptocurrency Futures Market Disclaimer 🚨🚨🚨
Trading cryptocurrency futures involves high risks and is not suitable for all investors.
Cryptocurrency prices are highly volatile, which can lead to significant gains or losses in a short period.
Before engaging in crypto futures trading, consider your risk tolerance, experience, and financial situation.
Risk of Loss: You may lose more than your initial capital due to the leveraged nature of futures. You are fully responsible for any losses incurred.
Market Volatility: Crypto prices can fluctuate significantly due to factors such as market sentiment, regulations, or unforeseen events.
Leverage Risk: The use of leverage can amplify profits but also increases the risk of total loss.
Regulatory Uncertainty: Regulations related to cryptocurrencies vary by jurisdiction and may change, affecting the value or legality of trading.
Technical Risks: Platform disruptions, hacking, or technical issues may result in losses.
This information is not financial, investment, or trading advice. Consult a professional financial advisor before making decisions. We are not liable for any losses or damages arising from cryptocurrency futures trading.
Note: Ensure compliance with local regulations regarding cryptocurrency trading in your region.
thanks for like and follow @ydnldn
About me :
"I am a passionate swing trader focused on analyzing financial markets to capture profit opportunities from medium-term price movements. With a disciplined approach and in-depth technical analysis, I concentrate on identifying trends, support-resistance levels, and price patterns to make informed trading decisions. I prioritize strict risk management to protect capital while maximizing profit potential. Always learning and adapting to market dynamics, I enjoy the process of refining strategies to achieve consistency in trading."
DYDXUSDTCryptocurrency Futures Market Disclaimer 🚨🚨🚨
Trading cryptocurrency futures involves high risks and is not suitable for all investors.
Cryptocurrency prices are highly volatile, which can lead to significant gains or losses in a short period.
Before engaging in crypto futures trading, consider your risk tolerance, experience, and financial situation.
Risk of Loss: You may lose more than your initial capital due to the leveraged nature of futures. You are fully responsible for any losses incurred.
Market Volatility: Crypto prices can fluctuate significantly due to factors such as market sentiment, regulations, or unforeseen events.
Leverage Risk: The use of leverage can amplify profits but also increases the risk of total loss.
Regulatory Uncertainty: Regulations related to cryptocurrencies vary by jurisdiction and may change, affecting the value or legality of trading.
Technical Risks: Platform disruptions, hacking, or technical issues may result in losses.
This information is not financial, investment, or trading advice. Consult a professional financial advisor before making decisions. We are not liable for any losses or damages arising from cryptocurrency futures trading.
Note: Ensure compliance with local regulations regarding cryptocurrency trading in your region.
thanks for like and follow @ydnldn


What if...What if instead of a 6-12 months long bull market instead we see a 2-3 years long bull market? What if...
Instead of one big extended bullish wave we see slow and steady growth long-term, with no more huge crashes as the market evolves. This already happened in the past leading to the 2017 cycle top. The market grew in 2015, 2016, 2017...
Here we have DYDX producing lower lows. Maybe supply is expanding, maybe something with the way the token works, I don't know, the chart is showing lower lows, but this is still a transition period, other charts are producing higher highs and higher lows.
The recent drop below the lower trendline is called an "excess," a market excess and this type of move tends to be corrected almost right away. The action will move back above the trendline and then produce strong growth.
What if instead of a super fast and strong bull market we get a long-term drawn out one. The latter scenario would be the best. What if... I am open to seeing it happen, what about you?
Thank you for reading.
Namaste.

dydx sell midterm "🌟 Welcome to Golden Candle! 🌟
We're a team of 📈 passionate traders 📉 who love sharing our 🔍 technical analysis insights 🔎 with the TradingView community. 🌎
Our goal is to provide 💡 valuable perspectives 💡 on market trends and patterns, but 🚫 please note that our analyses are not intended as buy or sell recommendations. 🚫
Instead, they reflect our own 💭 personal attitudes and thoughts. 💭
Follow along and 📚 learn 📚 from our analyses! 📊💡"

DYDX LOOKS LOOOOOOOOONGAccording waves analysis the most high volume dex exchange token looks crazy for long I’m in 🤑🤑🤑🤑🤑🤑

dydxusdtdydx usdt may be in the formation of deep crab .it seem ithas completed accumulation phase . never trad ewithout a sl .

#DYDX/USDT#DYDX
The price is moving within a descending channel on the 1-hour frame, adhering well to it, and is heading towards a strong breakout and retest.
We are experiencing a rebound from the lower boundary of the descending channel. This support is at 0.566
We are experiencing a downtrend on the RSI indicator, which is about to break and retest, supporting the upward trend.
We are heading towards stability above the 100 moving average.
Entry price: 0.575
First target: 0.584
Second target: 0.592
Third target: 0.602

DYDXUSDT 1D AnalysisDYDX ~ 1D Analysis
#DYDX Buy gradually from here with a short term target of at least 15%+.

Free signal todayHello friends
Given the good growth, now the price is correcting and we can buy within the support ranges with capital and risk management and move with it to the specified targets.
*Trade safely with us*

DYDX ANALYSIS📊 #DYDX Analysis
✅There is a formation of Falling Wedge Pattern on daily chart and currently trading around its support zone🧐
Pattern signals potential bullish movement incoming after the confirmation of retest
👀Current Price: $0.6344
🚀 Target Price: $0.7580
⚡️What to do ?
👀Keep an eye on #DYDX price action and volume. We can trade according to the chart and make some profits⚡️⚡️
#DYDX #Cryptocurrency #TechnicalAnalysis #DYOR

Dydx bullish Divergence Daily Time FrameFalling Wedge - Bullish Reversal
Bullish Divergence
Pull from falling wedge.

DyDx is reversing. Superb opportunityDyDx chart is looking good.
On 3D timeframe StochRSI is high - good momentum is building up
RSI started to make higher low
Price is testing 21MA and should break it soon
Also bullish divergence on RSI
1st impulse could be to 4-6$ region with huge correction afterwards.
Later in summer probably will see rise to 17$+

DYDX has shown bullish DivergenceDyDx has shown bullish Divergence on the daily timeframe.
DyDX is the L1 token for the dYdX Chain.