#DYDXUSDT#DYDXUSDT 4H
The price is now 2.77 dollars. As soon as the yellow trend line is broken up, the next resistance will be at 2.91 dollars. The support area that we showed with the box is very important because below this area we may have a change in the downward trend.
Technical analyst: Amir Hassan Salek
DYDXUSDT trade ideas

DYDXUSDT 2D#DYDX is moving inside a descending channel and it is above the MA100 on 2-days chart. It will attempt to break the resistance soon. The main targets are: $2.849 $3.241 $3.605 and $4.315
You can check the long-terms targets on the chart.

🔥 DYDX Local Update,Extremely Bullish Setup For 2024 👋 Hi Everyone ,Today I Wanna Analysis DYDX At Daily Timeframe And Talk About My Plan For a Midterm
📥 The Main Structure For DYDX Is an Impulsive Move Which Started From 1$ To 3.6$ As a Wave 1 And Bottom Of The Wave 2 Was 1.5$ Area And Now The Price Playing At Wave 3
👉 Currently The Price Playing At The Bull flag As a Wave 4 From 3 By Clear ABC Corrective Formation That Completed At The 2.3$ PRZ And We Had a Great Bounce From This Level So Now I Can Say Wave 5 From 3 Is About To Start
🎯 The Price Is Now Playing Below The 2.8$ Resistance And I Expect It Will Playing Below This Level For a While Then Breakout This Level Toward a 3.1$ As a Bull Flag Trend Line ,The Time That Price Breakout The Bull flag Next Targets Are 3.9$ And 5.7$ Areas
💥 Totally I’m Extremely Bullish About The DYDX And Expect It Will Surprise Many People In 2024

Dydx outlook i am looking forward to a partial TP (take profit) on dydx and the sentiment about it is bullish.

dydxusdt medium term tradeFor a medium-term trade analysis on DYDX/USDT, a careful examination of the chart indicates a potential price movement from $4.5 to $5. Anticipating a bullish trend, the technical indicators suggest favorable conditions for a medium-term trade. Traders may consider entry points around the current price levels, with an eye on the projected upward movement. However, it's crucial to monitor market dynamics and adjust the strategy accordingly to capitalize on potential gains within the specified target range.

Nice zoneThe intersection of dynamic and static support areas is very attractive for buying.
To be safer, let it grow from the support area and enter after the break of the downtrend line

Dydx outlookI anticipate that the price of dydx altcoin will increase in the higher timeframe. I have taken a long position on dydx due to its bullish sentiment. My expectation is that the price will rise further.

$DYDX Trading IdeaDYDX is still inside this descending channel (confirmed) on a 1D time frame. According to the money flow it's ready to pump because we are going from red to green again. We’ll see. Enjoy your Friday.

Dydx🔥 Dydx is bullish , long now with some confirmation , managing risk properly and taking profits along the way

Dydx/Usdt bearish bias under the cloudSeems that the lower part of the cloud is putting a strong resistance for this pair

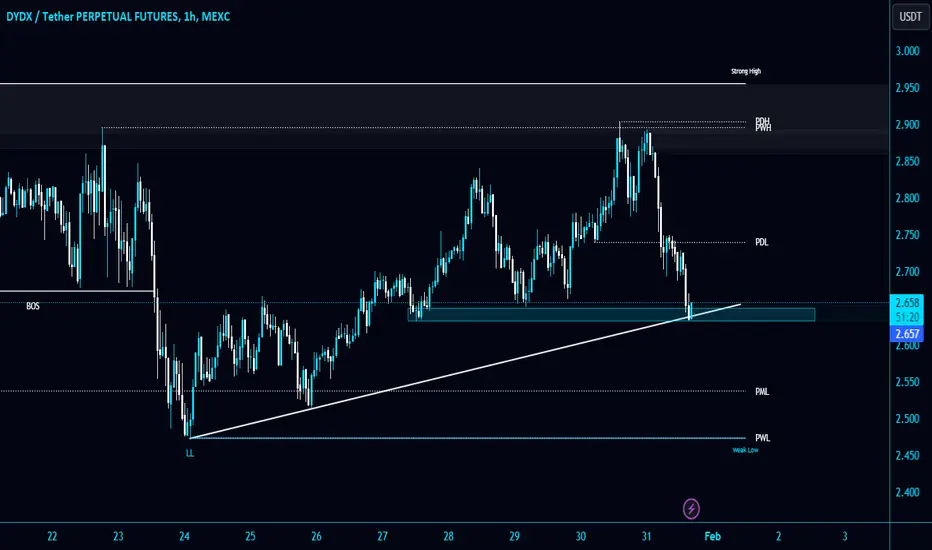
#DYDX/USDT is testing the Diagonal Trendline and Bullish OB in 1#DYDX/USDT is testing the Diagonal Trendline and Bullish OB in 1-Hour TF!
I am expecting a bounce from there. In case of breakdown and retest to short $DYDX.
The local resistance level is PDL $2.74 and support level is PML $2.54.
dydx to resistance dydxusdt to control point pivot before come to resistance
Please use risk management of 1-3% of your margin, use stop loss below the swing.

DYDXusdtwith the recent on chain perp dex explosion of promised airdrops for trading volume
the og highest volume dex perp has been abit ignored..
its consolidating in the same pattern we were seeing on other coins that marked up without a dip or a retrace... aka golden entries
with the ethereum etf rumour phase officially swinging i think that onchain perps based on the eth network will see a move also, obviously gas too high on eth for the average joe but this thing is also an L1 that can trade on its own network with much lower fees
one of the most functional products out there... and the highest volume through the bear market so it should perform coming into the bull...
high revenue generating product..

DYDX clear sky breakout soon?long idea risk/reward, clear and defined resistance no support, no resistances above. could go vertical.

DYDX ready for 10x lowest risk entry is HERE!?Unbelievable accumulation zone with S/R flipping bullish...
This could go far beyond expectations...
Possible life changing opportunity on this coin.

DydxHello friends,
I started buying Dydx today. An area with price compression. Moving averages are breaking upwards. You can see the high risk to reward and that a flag pattern has been formed.

DYDXUSDT.Pafter reaching the entry price, short position in 4H time frame on the prices shown on the chart would be profitable

Dydx long!I am looking to take my final profit at the zone of 2.705. Please note that you should take profit along the way. It is important to mention that dydx is bullish on htf.

DYDX - Which direction do you think?DYDX seems to be nearing the end of the contracting triangle. With a weekly close above $2.8, the first target will be $3.76.
If it is above $3.76, my expectation is $12.

DYDX - game overI think dydx and shiba and many of crypto or token ,near to finish .coming soon
BTC=7790$
but ETH can be stable and good crypto currency .

Long DYDX - Hopefully will breakout that Bullish Channel!Sitting on Daily 200 EMA, forming a bullish flag! With breaking out that channel we should get towards the $5 region!

DYDXUSDT long IdeaHello everyone!
Bullish breakout spotted! Planning to buy if the price sustains above the channel resistance, aiming for $3.00.
BINANCE:DYDXUSDT
⚠️ Hey friends, just a heads-up:
This content reflects my personal take on the market, driven by what's out there for everyone to see (news, reports, data) and my own trading experience. While some of my thoughts stem from actual trades, others are just me brainstorming. Remember, I'm not a financial advisor, so your trading decisions are yours and yours alone.
✅ Got questions or ideas? Hit the comments!
I'm always up for dissecting any crypto, currency pair, or stock index that catches your eye. Just drop a name or a chart, and let's explore it together!

DYDX ANALYSIS🔮 #DYDX Analysis 🚀🚀
💲💲 As we can see that there is a formation of Descending Channel Pattern in #DYDX and we can see a reversal from its major support zone. 📈📈
💸Current Price -- $2.604
📈Target Price -- $3.522
⁉️ What to do?
- We have marked crucial levels in the chart . We can trade according to the chart and make some profits. 🚀💸
🏷Remember, the crypto market is dynamic in nature and changes rapidly, so always use stop loss and take proper knowledge before investments.
#DYDX #Cryptocurrency #DYOR
