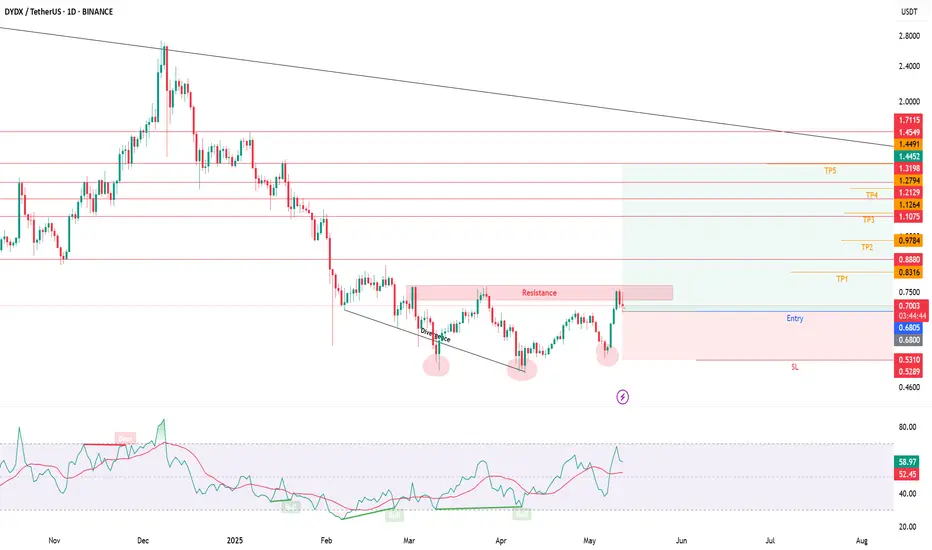
DYDX has shown bullish DivergenceDyDx has shown bullish Divergence on the daily timeframe.
DyDX is the L1 token for the dYdX Chain.
DYDXUSDT trade ideas
#DYDX#DYDX
The price is moving within a descending channel on the 1-hour frame, adhering well to it, and is heading for a strong breakout and retest.
We are seeing a bounce from the lower boundary of the descending channel, which is support at 0.
We have a downtrend on the RSI indicator that is about to break and retest, supporting the upside.
We are looking for stability above the 100 moving average.
Entry price: 0.706
First target: 0.741
Second target: 0.766
Third target: 0.800

dydx sell midterm"🌟 Welcome to Golden Candle! 🌟
We're a team of 📈 passionate traders 📉 who love sharing our 🔍 technical analysis insights 🔎 with the TradingView community. 🌎
Our goal is to provide 💡 valuable perspectives 💡 on market trends and patterns, but 🚫 please note that our analyses are not intended as buy or sell recommendations. 🚫
Instead, they reflect our own 💭 personal attitudes and thoughts. 💭
Follow along and 📚 learn 📚 from our analyses! 📊💡"

#DYDX/USDT#DYDX
The price is moving within a descending channel on the 1-hour frame, adhering well to it, and is on its way to breaking it strongly upwards and retesting it.
We are seeing a bounce from the lower boundary of the descending channel, which is support at 0.5000.
We have a downtrend on the RSI indicator that is about to break and retest, supporting the upward trend.
We are looking for stability above the 100 moving average.
Entry price: 0.543
First target: 0.563
Second target: 0.590
Third target: 0.623

DYDX Approaching Make-or-Break Pivot for Major ReversalThe DYDX/USDT weekly chart outlines a complex corrective WXY structure with price currently approaching the Immediate Drop Target Zone (IDTZ) near $0.50. A failure here could lead to a drop toward the Extreme Demand Zone around $0.079. However, reclaiming $1.132 and breaking above the descending trendline could trigger a bullish reversal toward the Important Supply Zone ($4.42–$4.55).

DYDXUSDT 1DDYDX ~ 1D Analysis
#DYDX If this is valid. This will be a double bottom. Buy gradually from here with a short -term target of at least 15%+.

DYDX USDT – 100x soon Yes, it is dull to make predictions, so I will make one.
DYDX USDT
First the last drop of the cycle -50%
Then moon
Something like this
Start $0,5 -> $2,5
Reversal $2,5 -> $1
Extension $1 -> $10
Reversal $10 -> $5
End $5 -> $55
This post is for entertainment only.
The information provided here is for general informational purposes only and does not constitute financial, investment, or other professional advice. Always seek the guidance of a qualified financial advisor before making any financial decisions. Past performance does not guarantee future results, and any investment involves risks. We are not responsible for any actions taken based on this information."

SWING BUY DYDX - 2025SWING BUY DYDX - 2025
Today, we’ve got a spot buy signal:
Signal: DYDX
Entry: Around $0.7
Targets: $1.2 - $1.4 - $2.9
Style: Swing Buy or Scalping—works with either strategy.
Good luck out there!

DYDXUSDT - a real oppurtunity!the coin is currently in a deep bottom compared to its December peak, having dropped over 80%.
Buying now is a rare opportunity that may not come again in the future.
On the 3-day chart there is a nicly breakout of a 4 months downtrend ...
the most important resistance is at the key level—once it breaks, the price will pump insanely.
best regards Ceciliones🎯

DYDXUSDT – Key Resistance Zones Marked!I’ve identified blue boxes as critical resistance areas—these are the levels where price could face heavy selling pressure. But remember, we don’t short blindly—we wait for confirmations.
📊 How I’m Trading This:
✅ Step 1: Watch for CDV confirmation is volume decreasing while price climbs?
✅ Step 2: Look for LTF breakouts downward a clean market structure shift signals entry.
✅ Step 3: If resistance holds + volume supports = I take the trade. If not, I step aside.
💡 Why This Matters:
Most traders short too early and get wrecked. I wait for clear signs of rejection before entering. That’s the difference between guessing and executing.
🔥 Final Thought:
If price suddenly breaks upwards and holds, I will not insist on a short. But if we see rejection + a retest? Then it’s go time. 🚀
📈 Follow for precision trades—because smart traders wait for the perfect moment. 🔥
A tiny part of my runners:
🎯 ZENUSDT.P: Patience & Profitability | %230 Reaction from the Sniper Entry
🐶 DOGEUSDT.P: Next Move
🎨 RENDERUSDT.P: Opportunity of the Month
💎 ETHUSDT.P: Where to Retrace
🟢 BNBUSDT.P: Potential Surge
📊 BTC Dominance: Reaction Zone
🌊 WAVESUSDT.P: Demand Zone Potential
🟣 UNIUSDT.P: Long-Term Trade
🔵 XRPUSDT.P: Entry Zones
🔗 LINKUSDT.P: Follow The River
📈 BTCUSDT.P: Two Key Demand Zones
🟩 POLUSDT: Bullish Momentum
🌟 PENDLEUSDT.P: Where Opportunity Meets Precision
🔥 BTCUSDT.P: Liquidation of Highly Leveraged Longs
🌊 SOLUSDT.P: SOL's Dip - Your Opportunity
🐸 1000PEPEUSDT.P: Prime Bounce Zone Unlocked
🚀 ETHUSDT.P: Set to Explode - Don't Miss This Game Changer
🤖 IQUSDT: Smart Plan
⚡️ PONDUSDT: A Trade Not Taken Is Better Than a Losing One
💼 STMXUSDT: 2 Buying Areas
🐢 TURBOUSDT: Buy Zones and Buyer Presence
🌍 ICPUSDT.P: Massive Upside Potential | Check the Trade Update For Seeing Results
🟠 IDEXUSDT: Spot Buy Area | %26 Profit if You Trade with MSB
📌 USUALUSDT: Buyers Are Active + %70 Profit in Total
🌟 FORTHUSDT: Sniper Entry +%26 Reaction
🐳 QKCUSDT: Sniper Entry +%57 Reaction
📊 BTC.D: Retest of Key Area Highly Likely
📊 XNOUSDT %80 Reaction with a Simple Blue Box!
📊 ORCAUSDT %29 Reaction with a Simple Blue Box!
I stopped adding to the list because it's kinda tiring to add 5-10 charts in every move but you can check my profile and see that it goes on..

#DYDX/USDT#DYDX
The price is moving in a descending channel on the 1-hour frame and is adhering to it well and is heading to break it strongly upwards and retest it
We have a bounce from the lower limit of the descending channel, this support is at a price of 0.760
We have a downtrend on the RSI indicator that is about to be broken and retested, which supports the rise
We have a trend to stabilize above the moving average 100
Entry price 0.770
First target 0.800
Second target 0.820
Third target .842

#DYDX/USDT#DYDX
The price is moving in a descending channel on the 1-hour frame and is expected to continue upwards
We have a trend to stabilize above the moving average 100 again
We have a descending trend on the RSI indicator that supports the rise by breaking it upwards
We have a support area at the lower limit of the channel at a price of 0.633
Entry price 0.647
First target 0.662
Second target 0.675
Third target 0.691

#DYDX/USDT#DYDX
The price is moving within a descending channel on the 1-hour frame, adhering well to it, and is on its way to breaking it strongly upwards and retesting it.
We are seeing a rebound from the lower boundary of the descending channel, which is support at 0.5050.
We have a downtrend on the RSI indicator that is about to break and retest, supporting the upward trend.
We are looking for stability above the 100 moving average.
Entry price: 0.7529
First target: 0.6467
Second target: 0.6932
Third target: 0.7529

DYDX/USDT – Working within the horizontal channel. Continuation.dYdX - is DeFi’s pro trading platform and a pioneer in decentralized finance, known for being the first to offer decentralized margin trading and derivatives, as well as inventing flash loans and DEX aggregators in 2018. Built on a custom Layer-1 blockchain using the Cosmos SDK, dYdX provides a professional-grade, decentralized trading experience with high leverage, deep liquidity, and low fees. Governed by the community through the DYDX token, dYdX is focused on delivering a transparent and user-driven financial system.
CoinMarketCap : #107
I've been working within this channel for about 2.5 years.
From my previous trading idea, two marked zones were reached:
1.6447 (+80%)
2.5007 (+176%)
The maximum squeeze reached +185.5%.
I'm continuing to work within the channel.
Last time, liquidity was accumulated below the support of the inner channel.
Now, liquidity is being gathered below the support of the outer channel—as always.
I've marked potential final liquidity grabs on the chart, as well as resistance zones where the price is likely to react.
The profit is significant, and if you work with compound interest, well… I'll just keep quiet—not everyone understands this and keeps waiting for the final rally.
A reminder:
Right now, fear dominates across all coins. This is the phase where nobody wants to buy or where many have already run out of funds. Why? Because, as always, most people buy at the top.
Take all of this into account in your trading strategy.

DYDXUSDT 1DDYDX ~ 1D Analysis
#DYDX High risk trading, buy after successfully penetrating this resistant line with a short -term target of at least 10%+.

dydx buy midterm "🌟 Welcome to Golden Candle! 🌟
We're a team of 📈 passionate traders 📉 who love sharing our 🔍 technical analysis insights 🔎 with the TradingView community. 🌎
Our goal is to provide 💡 valuable perspectives 💡 on market trends and patterns, but 🚫 please note that our analyses are not intended as buy or sell recommendations. 🚫
Instead, they reflect our own 💭 personal attitudes and thoughts. 💭
Follow along and 📚 learn 📚 from our analyses! 📊💡"

DYDX Once #DYDX can break out of this falling wedge we can build some strength leading into #ALT season.

DYDX/USDT 1W 🩸 $DYDX ⁀➷
#dYdX. Macro chart Another
💯 Intermediate Target - $7.80
🚩 Macro Target 1 - $13.60
🚩 Macro Target 2 - $28.80
🚩 Macro Target 3 - $55.90
- Not financial advice, trade with caution.
#Crypto #dYdX #DYDX #Investment
✅ Stay updated on market news and developments that may influence the price of dYdX. Positive or negative news can significantly impact the cryptocurrency's value.
✅ Exercise patience and discipline when executing your trading plan. Avoid making impulsive decisions driven by emotions, and adhere to your strategy even during periods of market volatility.
✅ Remember that trading always involves risk, and there are no guarantees of profit. Conduct thorough research, analyze market conditions, and be prepared for various scenarios. Trade only with funds you can afford to lose and avoid excessive risk-taking.

DYDX (dYdX) | DYDX/USDT-Daily Tmeframe
Still in a downtrend since the price is below the 200-day moving average (1.1810 USDT).
Consolidating around 0.78 USDT, meaning no further drop for now, but no strong uptrend either.
RSI (39.84) is still below 50, so buyers aren’t strong yet, but it has exited the oversold zone, which is a good sign.
Low trading volume, meaning big players haven’t stepped in yet.
Don’t rush to buy! Better to wait for a breakout above 0.85 - 0.90 USDT or strong buying momentum.
If you already bought, watch how it reacts to resistance before deciding.
Stop-loss below 0.70 USDT makes sense—stick to it if you enter.
No strong buy signal yet, but it’s stabilizing a bit. If you want to take the risk, use a stop-loss and keep an eye on resistance levels.
Good luck everyone & Be profitable🤘🏼
📌 It's not financial advice 📌

DydxusdtSince Bit had to make a pullback and they did this under the pretext of news so that they could create good liquidity, dydx also made a pullback and is ready to rise very high, which may hit my target of 0.965 next week.

DYDXUSDT UPDATEDYDXUSDT is a cryptocurrency trading at $0.8384. Its target price is $1.0000, indicating a potential 90%+ gain. The pattern is a Bullish Falling Wedge, a reversal pattern signaling a trend change. This pattern suggests the downward trend may be ending. A breakout from the wedge could lead to a strong upward move. The Bullish Falling Wedge is a positive signal, indicating a potential price surge. Investors are optimistic about DYDXUSDT's future performance. The current price may be a buying opportunity. Reaching the target price would result in significant returns. DYDXUSDT is poised for a potential breakout and substantial gains.

DYDX: Easy 2025 Target @$6.22 —But Wait, Much Higher Is PossibleSome projects produced a very strong bullish wave to end 2024. Other projects didn't do much.
We have pairs that are now very close to their All-Time High.
Some other pairs are trading at, or very near to, an All-Time Low.
I think this is why it is so very important to consider each chart individually. We can have a general market perspective and develop a general bias, but when it comes to trading, buying and selling, each pair needs to be considered on its own.
DYDXUSDT recently hit a new All-Time Low. This is not bad. Actually, this is very good.
A pair like this we can buy without reservation because the downside is very limited, especially when the next advance is fully confirmed.
As for the 2025 bull-market top, we say that higher lows lead to higher highs. A lower low can lead to a lower high, that is, no new All-Time High in 2025.
When a project's chart looks like this one we become more conservative with the final target.
Not that a new ATH won't happen but that weakness has been revealed and we work with this information.
The bottom for DYDX is likely in. We have the same volume dynamic as mentioned in a previous publication; a lower low with decreasing volume. On this chart, bull volume is predominant and this is a signal of strength.
The final flash-crash seems like a shakeout move; the market looking for liquidity by breaking support. This thinking would be reinforced if a strong and fast recovery were to happen in the coming weeks and days. If the price remains low and trades lower for a while before recovering then we have to go with the weakness theory.
My belief is that DYDX will recover and it will grow super strong in the coming months.
If I had to make a prediction for a final target, I would say $18-19 is possible. The target mapped on the chart is an easy one and amounts to ~700%.
Thank you for reading.
After the bull-market starts to unravel, many pairs will move ahead of the pack and reveal what will be coming to the rest of the market. At that time, we can update our peak numbers and make more accurate predictions.
It is still too early, but we know the bull-market will be huge. The fact that the top Cryptos are not dropping and have been consolidating for months near resistance means that the market is not ready to sell. If the market isn't selling it is because it sees value in what it holds. If the whales and exchanges are ready to hold, this means that they are going to pump this market like never before.
Namaste.

DydxusdtThe market is completely bullish, and Bitcoin Dominance is completely bearish, and I hope that altcoins will suffer from our embarrassment for the past few days. I am long from 0.79 and my target is 0.965
