#DYM/USDT#DYM
The price is moving in a descending channel on the 1-hour frame and is expected to continue upwards
We have a trend to stabilize above the moving average 100 again
We have a descending trend on the RSI indicator that supports the rise by breaking it upwards
We have a support area at the lower limit of the channel at a price of 1.38
Entry price 1.38
First target 1.42
Second target 1.45
Third target 1.49
DYMUSDT trade ideas

$DYM It is a fake BO, in my opinion. The price will reach the support level and bounce back to the pattern. For the next move, I expect another breakout, but bullish. That white box could be a good selling point. Then we'll have to wait and see what happens next.

$DYM It is a fake BO, in my opinion. The price will reach the support level and bounce back to the pattern. For the next move, I expect another breakout, but bullish. That white box could be a good selling point. Then we'll have to wait and see what happens next.
SPOT DYM LONG 15.12.2024🎯Purpose:
3.393
‼️Risk per trade: 0.5% of the allocated funds for spot trading.

DYM - 5$Test of a broken trend line, you need to consolidate above 2.3 on the day and expect growth to $5, there is strong resistance there

#DYM/USDT broke out of the symmetrical triangle accumulation and#DYM/USDT broke out of the symmetrical triangle accumulation and flipped above the Superguppy Dynamic Resistance👀
ASX:DYM I am looking for the key zone + 0.236 fib confluence to be broken as well and rally📈
✔️1TP - 5.965$
✔️2TP - 8.735$
✔️3TP - 13.555$

Long trade idea for DYMUSDTLong trade idea for DYMUSDT
Falling Wedge measured from AUG 2024
Potentially min 216% profit from current date. Target $8.345
Do note potential pullback according to purple line.
Note that there are Bearish Order Blocks as shown.
Do exercise due diligence and that all trades comes with risks

HiLoCh on Dymgot the triggers, cipher and RSI good, nice b pattern and nice level reclaim. only issue is we have a really strong level just below which will be interesting if the liquidity draw down doesn't occur

#DYM/USDT#DYM
The price is moving in a descending channel on a 1-day frame and is sticking to it to a large extent and is expected to break it upwards
We have a bounce from the lower limit of the channel at a price of 1.00
We have an upward trend on the RSI indicator, which supports the rise
We have a trend to stabilize above the moving average 100
Entry price 1.40
First target 1.87
Second target 2.52
Third target 3.00

DYMUSDT IS to brake harigental resistance...use 5 % of your capital..
good R/R ratio ,
coin is fundamentally good as well

DYMUSDT A Bearish Shift in Play? Key Level to Watch.Yello, Paradisers! Is #DYMUSDT gearing up for a bigger move, or could we see a deeper dip? Here's what we need to watch closely:
💎#DYM has confirmed a bearish reversal after breaking below the support trendline and losing its previous higher low structure. This shift signals potential bearish momentum, especially as the price gears up to test the supply zone between $1.38 - $1.50. If the price faces rejection here, it strengthens the case for a continuation of the downward movement, aiming for the first target at the demand zone.
💎Should we see a rebound in this area, it might indicate a temporary pause. However, if the price manages to reclaim and hold above the supply zone, there's a higher probability of reaching the final take-profit target at the major support level.
💎If DYM closes above the resistance, it would signal a potential return to bullish momentum, rendering any short positions invalid.
Trade smart, stay vigilant, and remember – patience and discipline always win the day.
MyCryptoParadise
iFeel the success🌴

DYMUSDT A Critical Moment Approaching? Keep an eye on this levelYello, Paradisers! Have you been keeping an eye on #DYMUSDT? If not, you might want to pay attention—this setup could go either way, and fast. Let’s break it down.
💎#DYM has recently hifted into a bullish trend, successfully breaking out of its descending resistance. However, the price is now likely to retest a crucial support zone around 2.055 - $1.88, aligning perfectly with the Fibonacci golden ratio (0.618)—a level traders often watch closely. If the price respects this support area, there’s a strong possibility we’ll see a continuation of the bullish momentum toward the major resistance level.
💎 If DYM fails to rebound from this support zone and breaks below it, the move could turn into a false breakout scenario. In this case, the highest probability shifts toward a downward trend, potentially heading to the next major support level.
💎For the bullish scenario to remain valid, DYM must rebound strongly from the support zone and reclaim demand levels. However, if the price breaks the major support and the daily candle closes below it, this would confirm a bearish trend. In that case, DYM could slide even deeper into bearish territory.
Stay patient, disciplined, and play it safe by waiting for the highest-probability setups before taking action. A clear confirmation is key to success in this volatile market.
MyCryptoParadise
iFeel the success🌴

DYMUSDT Forms Triangle Pattern!DYMUSDT Technical analysis update
DYMUSDT has been trading within a triangle formation for the past 165 days. The price is now moving towards the triangle's resistance level, potentially signaling a breakout. The profile volume indicates strong support at $1.40, and the price has crossed above the 100 EMA on the daily chart. A strong bullish move can be expected from the current level.
Buy zone : Below $1.70
Stop loss : $1.37
Take Profit 1: $1.97
Take Profit 2: $2.47
Take Profit 3: $3.45

3 Small Cap Crypto to watch...Since you enjoyed my previous post about 3 Crypto OGs to watch this month...
Here's an interesting one about small market cap altcoins:
BINANCE:DYMUSDT
DYM has been hovering within a narrow range after rejecting the round number $1.
Waiting for a break above the upper bound of the range at $2.15 to activate the setup and target the $5 mark.
BINANCE:CYBERUSDT
CYBER has been hovering within a narrow range after rejecting the round number $3.
Waiting for a break above the upper bound of the range at $5 to activate the setup and target the $9.5 mark.
KUCOIN:RIOUSDT
CYBER has been hovering within a narrow range after rejecting the round number $0.5.
Waiting for a break above the upper bound of the range at $1 to activate the setup and target the $2 mark.
Which altcoins would you like me to cover next?
All Strategies Are Good; If Managed Properly!
~Rich

DYMUSDT will pump soon possible 200 percent or more full this BuLooks like a very bullish pattern developing and i will be watching for a break out above 2.2492
should pump 100 percent to its high and go more ....hopefully....lol

DYM - A Whole Different Dimension...Dear TradingView community and fellow traders,
I am Richard, also known as theSignalyst.
I find the DYM daily chart to be intriguing as it appears to be following the famous Wyckoff Cycle.
I would like to apply Richard Wyckoff's four market stages/phases to this chart for analysis as a practical example.
1️⃣ MarkDown
After being listed, DYM was bearish making lower highs and lower lows.
2️⃣ Accumulation
DYM is currently trading within a big range between $1 and $2.4 in the shape of symmetrical triangle.
3️⃣ MarkUp
For the MarkUp phase to start, a break above the upper bound of the range at $2.4 is needed.
I hope you find this post useful, and I would appreciate your likes and support.
Which scenario do you think is more likely to happen first? and why?
📚 Always follow your trading plan regarding entry, risk management, and trade management.
Good luck!
All Strategies Are Good; If Managed Properly!
~Richard

DYMUSDTDYM ~ 2D
#DYM Entering the accumulation zone. selling pressure began to weaken and showed indications of accumulation by large players.
If you have Conviction on the coin. Make buy from here, with a minimum target of 20%++
Trade Signal for DYMUSDT: Buy OpportunityAttention traders! We have identified a promising buy opportunity for the DYMUSDT trading pair based on our analysis using the EASY Quantum Ai strategy.
Direction: Buy
Enter Price: 1.33
Take Profit: 1.36766667
Stop Loss: 1.27466667
Our forecast is based on the following key factors:
1. Technical Indicators Alignment: Recent analysis shows that key technical indicators, such as moving averages and RSI, are indicating a bullish momentum for the DYMUSDT pair.
2. Market Sentiment: The current market sentiment for the cryptocurrency market and recent news suggest positive sentiment, aligning with our expected upward movement.
3. Volume Analysis: Increased trading volume in DYMUSDT has been observed, which typically precedes a continued movement in the direction of the stronger trend.
Remember that while the EASY Quantum Ai strategy provides data-driven insights, all trading involves risk. Please ensure proper risk management practices when executing this trade.
Happy trading, and let's aim for success!

DYMUSDTOn the DYMUSDT chart, we observe recent sideways movement, suggesting a period of consolidation 📊. The price has formed a bottom and reached MA144, which currently acts as resistance 🚧. However, given the current market context, there is potential for an explosive increase 🚀. The displayed price targets indicate potential levels, with a possible high of $34. Although ambitious, this target is achievable under the right market conditions. Considering these factors, I am holding a long position on DYMUSDT.

DYM. Speculative investment. $1.5 ---> $11+They dump the price at the beginning to handle sell pressure. In the green zone (low), the strategic market makers will buy again and use cheap tokens + small selling pressure for a global pump.
I don’t know where to sell, because markets are not static, team plans are not static, nothing is static. But I believe that $11+ is the minimal target in a successful case.
This theory works only if you researched & found a special format of token unlocks after the project launch (not team & core unlocks).
~$11 means ~$4.6 billion market cap on the highest price.

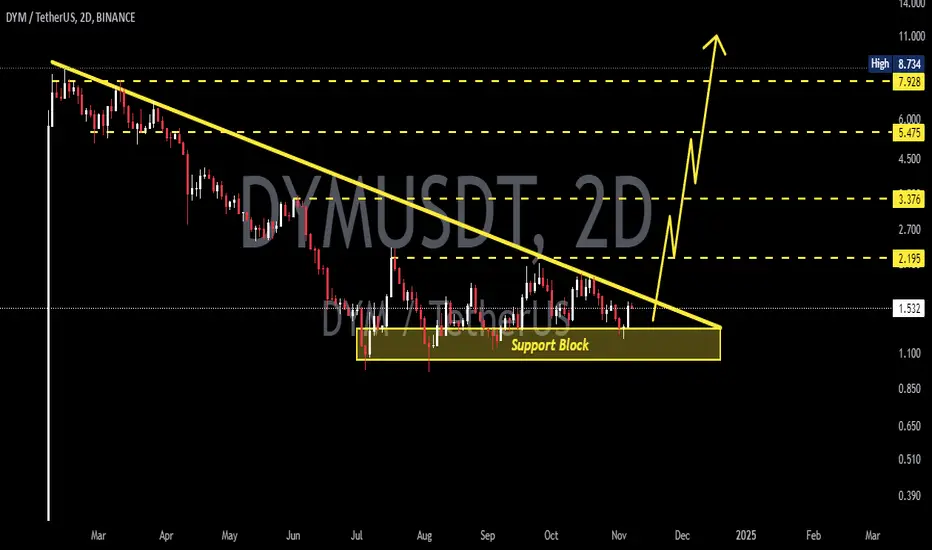
$dym Dymension's Symmetrical TriangleASX:DYM has respected this symmetrical triangle since June 2024
Expect fireworks once break out is confirmed.
#dym Current Price: 1.54
Targets: 2.8
Invalidation under 1.42

Scalp DymScalp entry: latest highs
SL , just above those
TP -> 2xSL
I'm trying to find a set and forget scalping strategy . I need 50% win rate. On 100 trades we'll have 50 times Risk%

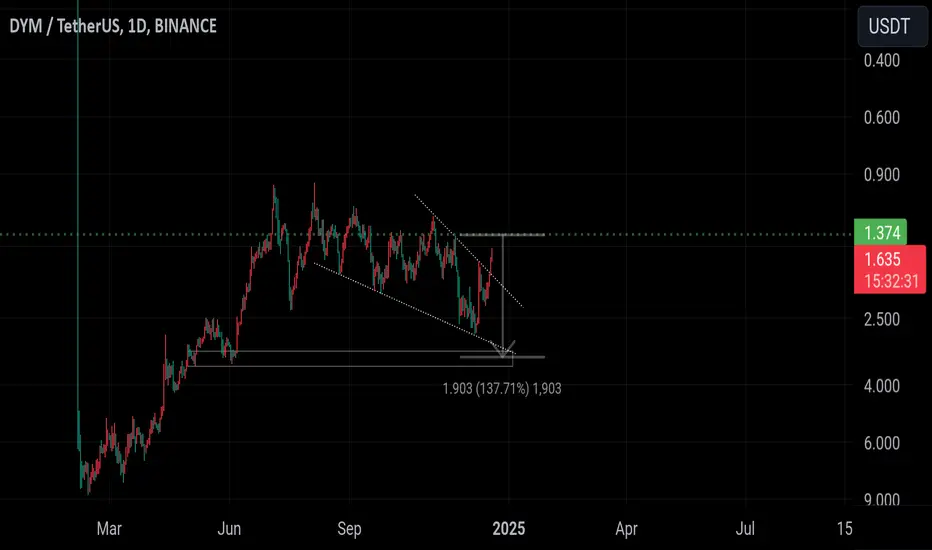
#DYM: The Next Big Move? A 275% Opportunity Awaits!The #DYMUSDT is showing a promising descending channel pattern, typically a precursor to a bullish reversal. The price is currently trading at $1.407, close to the lower boundary of the channel, suggesting that a potential breakout could be on the horizon.
If the breakout materializes, the measured move from this pattern projects a target of $3.880, offering an impressive 275.28% gain. Volume is gradually picking up, and traders are closely watching for a break above the upper trendline as a confirmation signal.
This setup provides a compelling risk-reward scenario for those eyeing a significant price surge. As always, confirmation is key, so monitoring price action and volume closely is essential before making any trading decisions.
