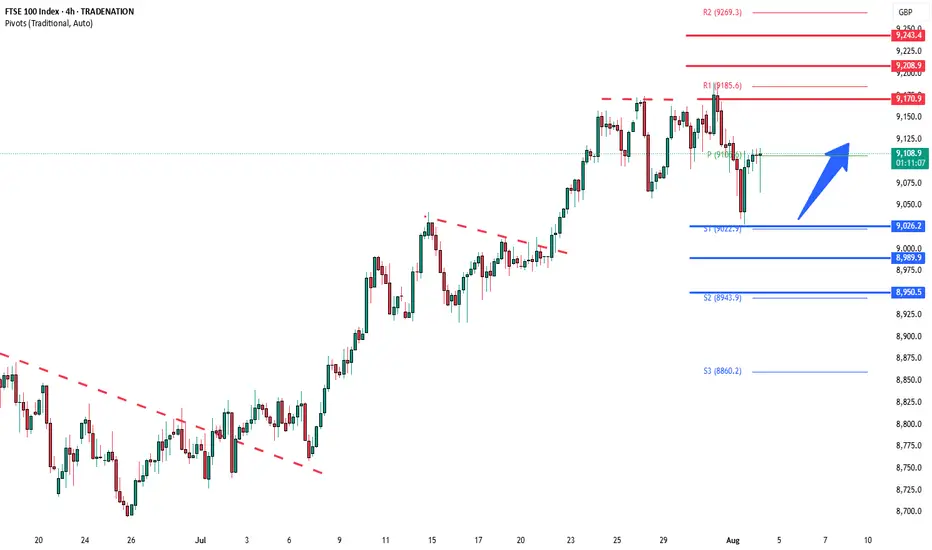
FTSE uptrend pause supported at 9026The FTSE remains in a bullish trend, with recent price action showing signs of a corrective pullback within the broader uptrend.
Support Zone: 9026 – a key level from previous consolidation. Price is currently testing or approaching this level.
A bullish rebound from 9026 would confirm ongoing upside momentum, with potential targets at:
9170 – initial resistance
9208 – psychological and structural level
9245 – extended resistance on the longer-term chart
Bearish Scenario:
A confirmed break and daily close below 9026 would weaken the bullish outlook and suggest deeper downside risk toward:
8990 – minor support
8950 – stronger support and potential demand zone
Outlook:
Bullish bias remains intact while the FTSE holds above 9026. A sustained break below this level could shift momentum to the downside in the short term.
This communication is for informational purposes only and should not be viewed as any form of recommendation as to a particular course of action or as investment advice. It is not intended as an offer or solicitation for the purchase or sale of any financial instrument or as an official confirmation of any transaction. Opinions, estimates and assumptions expressed herein are made as of the date of this communication and are subject to change without notice. This communication has been prepared based upon information, including market prices, data and other information, believed to be reliable; however, Trade Nation does not warrant its completeness or accuracy. All market prices and market data contained in or attached to this communication are indicative and subject to change without notice.
FTSGBP trade ideas
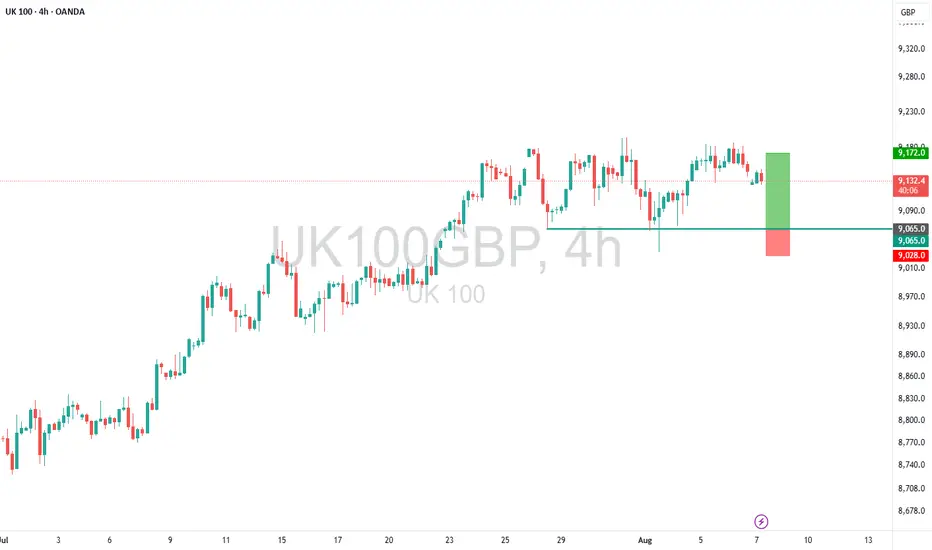
UK100 – Buy into Dip Ahead of BoE VolatilityTrade Idea
Type: Buy Limit
Entry: 9065
Target: 9172
Stop Loss: 9028
Duration: Intraday
Expires: 08/08/2025 06:00
Technical Overview
Price action appears to be forming a top, but short-term bias remains mildly bullish.
Lower correction is expected, presenting an opportunity to buy near bespoke support.
We prefer to fade into the dip with a tight stop, anticipating a resumption of the uptrend.
Bespoke support: 9065.
Key Technical Levels
Resistance: 9290 / 9485 / 9770
Support: 8915 / 8620 / 8390
Next Volatile Events (GBP)
12:00 – BoE Interest Rate Decision
12:00 – BoE Minutes / MPC Votes / Policy Summary & Report
12:30 – BoE's Governor Bailey Speech
Disclosure: I am part of Trade Nation's Influencer program and receive a monthly fee for using their TradingView charts in my analysis.
FTSE oversold bounce backThe FTSE remains in a bullish trend, with recent price action showing signs of a corrective pullback within the broader uptrend.
Support Zone: 9026 – a key level from previous consolidation. Price is currently testing or approaching this level.
A bullish rebound from 9026 would confirm ongoing upside momentum, with potential targets at:
9170 – initial resistance
9208 – psychological and structural level
9245 – extended resistance on the longer-term chart
Bearish Scenario:
A confirmed break and daily close below 9026 would weaken the bullish outlook and suggest deeper downside risk toward:
8990 – minor support
8950 – stronger support and potential demand zone
Outlook:
Bullish bias remains intact while the FTSE holds above 9026. A sustained break below this level could shift momentum to the downside in the short term.
This communication is for informational purposes only and should not be viewed as any form of recommendation as to a particular course of action or as investment advice. It is not intended as an offer or solicitation for the purchase or sale of any financial instrument or as an official confirmation of any transaction. Opinions, estimates and assumptions expressed herein are made as of the date of this communication and are subject to change without notice. This communication has been prepared based upon information, including market prices, data and other information, believed to be reliable; however, Trade Nation does not warrant its completeness or accuracy. All market prices and market data contained in or attached to this communication are indicative and subject to change without notice.

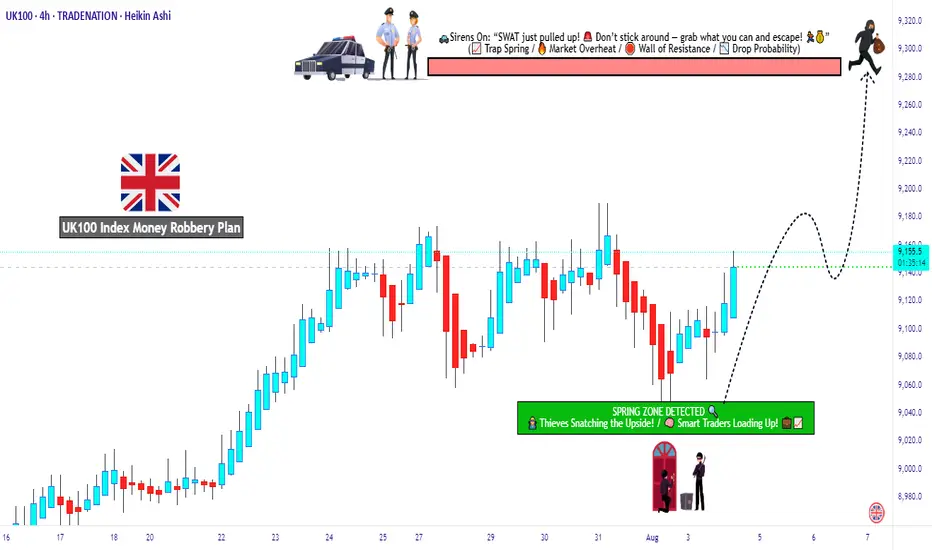
Is UK100 Setting Up the Cleanest Bull Robbery This Week?🏴☠️💹“UK100 Bullish Bank Job Heist 🧠💰” – Thief Trader Limit Order Operation 🚨📊
📢 Calling all stealthy traders, market pirates, and strategic looters! The vault is open, and the FTSE100 (UK100) index is now under our radar for a planned bullish extraction. This ain’t no regular trade — this is a Thief-Style Layered Entry Operation™.
🎯 Plan of Attack:
Asset: UK100 / FTSE100
Bias: Bullish
Entry: Any price level — we layer like legends (multiple limit orders across price zones)
Stop Loss: 9040.0 (vault protection level 🔐)
Target: 9280.0 (loot zone confirmed 🎯)
🧠 Thief Strategy Breakdown:
🔎 Why Bullish?
The setup is showing signs of accumulation + macro support, with strong risk-to-reward potential. Market exhaustion and liquidity traps are visible — it’s time to slip in quietly and stack long orders like a silent thief in the night.
📈 Execution Plan:
🔹 Use limit orders below current price (layer across price pockets)
🔹 DCA-style entries for better average and flexibility
🔹 Risk small, aim large
🔹 Always watch for market traps or surprise bear moves
🛡️ Stop-Loss Logic:
Below structure zones or 4H support – ~9040.0
Don't get greedy — protect the bag at all times.
🚪 Target the Escape:
Primary TP set at 9280.0
Optional: secure partials earlier using trailing SL once price breaks above 9200 zone.
📊 Trader Alerts:
⚠️ Avoid new positions during high-impact UK news
📅 Check for BOE surprises or global market shocks
🔁 Trail stops — don’t let profits vanish like a clumsy thief
📌 Notes from the Underground Vault:
🔐 This trade idea is based on market structure + liquidity flow
📌 Not financial advice — always rob with your own blueprint
💼 Trade light. Think sharp. Escape clean.
🔥 Join the Robbery Squad
Smash the idea boost 💥 if you're running this setup too.
💬 Drop a “HEIST LOADED” in the comments if you're in. Let’s loot this market the smart way — layered, patient, and untraceable. 🏴☠️💸
FTSE deeper corrective pullback supported at 9026The FTSE remains in a bullish trend, with recent price action showing signs of a corrective pullback within the broader uptrend.
Support Zone: 9026 – a key level from previous consolidation. Price is currently testing or approaching this level.
A bullish rebound from 9026 would confirm ongoing upside momentum, with potential targets at:
9170 – initial resistance
9208 – psychological and structural level
9245 – extended resistance on the longer-term chart
Bearish Scenario:
A confirmed break and daily close below 9026 would weaken the bullish outlook and suggest deeper downside risk toward:
8990 – minor support
8950 – stronger support and potential demand zone
Outlook:
Bullish bias remains intact while the FTSE holds above 9026. A sustained break below this level could shift momentum to the downside in the short term.
This communication is for informational purposes only and should not be viewed as any form of recommendation as to a particular course of action or as investment advice. It is not intended as an offer or solicitation for the purchase or sale of any financial instrument or as an official confirmation of any transaction. Opinions, estimates and assumptions expressed herein are made as of the date of this communication and are subject to change without notice. This communication has been prepared based upon information, including market prices, data and other information, believed to be reliable; however, Trade Nation does not warrant its completeness or accuracy. All market prices and market data contained in or attached to this communication are indicative and subject to change without notice.
UKX Trending UpUKX bullish continuation.
It could pull back to 8900 and continue with the Head and Sholder pattern on the weekly time scale with a price target of 9975.
Pattern and breakout confirmed.

UK100 - TIME TO DESTRUCTION UK TO HELLTeam, UK100 market is tank,
the economy is SH*T, not in a great shape
unemployment rising, crime increasing, jobless
inflation is out of control, but the market has not recognised the effect.
TIME TO PUT AN END TO THIS ERA - short range at 9175-9186
STOP LOSS AT 9225
EASY target 1 at 9152-42 - take 50% profit and bring stop loss to BE
Target 2 at 9128-9112
GOOD LUCK

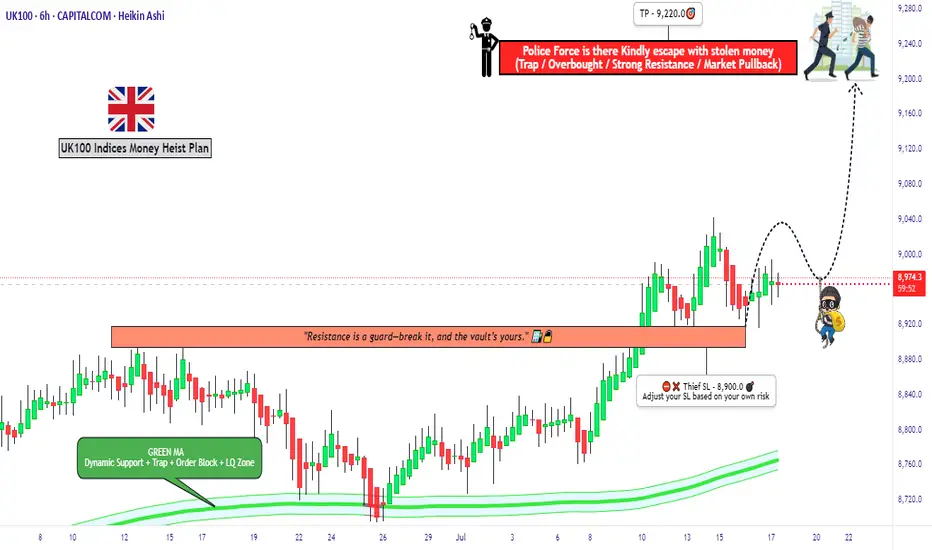
"UK100 Bulls Vault Open! Grab the Loot & Escape Early"🏴☠️💰"UK100 / FTSE100 Market Heist Blueprint" – A Thief Trading Operation for High-Profit Target Extraction 💼📈
🌍 Hola! Hi! Bonjour! Ola! Hallo! Marhaba!
To all the Market Robbers, Smart Thieves, and Strategic Money Makers — welcome to another Thief Trading Heist Plan™.
Ready your gear and charts — the UK100 / FTSE100 index is our next vault.
🔥Heist Objective: Swipe the Bullish Loot Before the Police Trap Hits! 🔥
Based on sharp Thief-style technical and macro-fundamental analysis, the market is showing bullish exhaustion and early signs of trap reversal zones. Our goal is clear: extract max value from the bulls and escape before the heat catches on.
🚨The current price action is nearing a Red Zone — high-risk area filled with potential police traps (supply zones, resistance, and bear setups). Timing and smart entries are key.
🎯 Strategy Overview (Day/Swing Trade)
Entry Plan:
🟢 “The Vault’s Open!” – Start accumulating long positions now or set buy limits near recent 15m/30m swing lows. Layer your entries (DCA method) for better control and efficiency.
Stop Loss (SL):
🔐 SL below recent swing low on 4H timeframe (~8900.0)
Adjust based on your risk appetite, position size, and how many layered orders you've got lined up.
Target Zone (TP):
🏁 Primary Target: 9220.0
Always be ready to exit early if market signals shift. He who escapes lives to rob another day.
🧲 Scalpers Note:
Only operate long within this framework. Big capital players can jump in earlier; others can trail behind with the swing traders. Always use trailing SLs to lock in stolen loot and reduce exposure.
📰 What's Driving the Market?
Current bullish sentiment is backed by:
Fundamental strength
Sentiment & COT reports
Macro data & intermarket correlation
Geopolitical & institutional flow analysis
Stay updated through your reliable sources and plug into key market dynamics and positioning reports.
⚠️ Trading Precaution:
🚫 Avoid new positions during high-impact news
💼 Manage your trades with care
🔁 Use trailing SLs to secure profits during volatility
💥Boost the Robbery – Support the Crew💥
If this heist plan aligns with your mission, smash that Boost button. Support the thief movement, and let’s build a strong trading crew where money is made with precision, strategy, and no mercy. 💰🤑
🔒 Final Notes (Read Before You Rob):
📌 This is a strategic trade setup, not financial advice. Always tailor the plan based on your risk management, capital size, and market conviction.
📌 Markets evolve. Stay alert, adapt fast, and trade like a thief — unseen, smart, and always two steps ahead.
💬Drop your thoughts, results, or setups below — and if you're in, type "HEIST READY" in the comments.
Stay tuned, another plan is on the way... 🏴☠️📊🔥
UK 100 – Moving Back Into the Spotlight It’s been a while since we covered the UK 100, but it feels like recent moves and the fact there is a Bank of England (BoE) rate decision next Thursday (August 7th) means it warrants some extra attention.
For much of 2025 the UK 100 has been the under achiever when compared to other European indices, but things have changed slightly in July as a result of the breakout above the previous all-time high at 8909 (more on this below in technical update) which has led to multiple record peaks all the way up to the most recent one registered on July 28th at 9177.
This up move has been aided by bullish technical momentum, a weaker GBPUSD exchange rate, which can add support to the index given that UK 100 companies are multi-national, earning over 60% of their revenue outside of the UK, and increased expectations for a BoE rate cut of 25bps (0.25%) at their next rate meeting on Thursday August 7th.
Now, looking forward, before traders get ready for that BoE meeting, they must contend with the challenges presented by President Trump’s trade policy and two key US economic data releases that could impact sentiment towards the UK 100 into the weekend. The first piece of data is the US PCE Index inflation print, released later today at 1330 BST and the second is tomorrow’s Non-farm Payrolls update at 1330 BST.
Once traders have more clarity on the outlook for global trade after President Trump’s August 1st tariff deadline has passed, alongside the fresh insight into the current path of US inflation and the health of the labour market provided by these two pivotal pieces of economic data, their preparation can begin for a potential 25bps (0.25%) rate cut in the UK, as the market expects and the accompanying commentary from BoE Governor Bailey in the press conference on whether more cuts could be in the pipeline across the remaining months of 2025.
Technical Update: Assessing the Current Uptrend
Since posting a low of 7525 on April 7th it has been a positive period of trading for the UK 100 index, a move that has seen a near 22% advance. As the chart below shows, except for the decline down to 8692 on June 26th, this has been an almost uninterrupted phase of price strength, as a positive pattern of higher price highs and higher price lows has materialised.
Of course, there is no guarantee that this type of positive pattern will extend and continue to see new all-time highs posted, but traders may be anticipating further attempts at upside price extension, especially while support below current price levels remains intact.
So, with this in mind, let’s look at what could be the relevant support and resistance levels that might influence trader sentiment over upcoming sessions.
Potential Support Levels:
While Monday did see a new all-time high posted at 9177, a price sell-off then materialised to register a low for the day at 9060, but with support being found at this level, it might be suggested this now represents a higher low within the positive trend and as such, is potentially now the first support focus, as the chart below shows.
Traders may find it useful to monitor how 9060 performs as a support on a closing basis, as if it were to give way over coming sessions, a more extended phase of price weakness may result. Such downside support breaks could then see the focus shift to the 38.2% Fibonacci retracement of June 26th to July 28th strength which stands at 8990, possibly even the 50% level at 8933.
Potential Resistance Levels:
Having been capped by the July 28th high at 9177, the UK 100 index may now need to see successful closing breaks above this level to suggest a continuation of the recent positive price trend.
Successful closing breaks above the 9177 high, may be an indication of continued price strength, opening potential for moves to the next possible resistance at 9253, which is the 161.8% Fibonacci extension, even 9335, the higher 200% extension level.
The material provided here has not been prepared accordance with legal requirements designed to promote the independence of investment research and as such is considered to be a marketing communication. Whilst it is not subject to any prohibition on dealing ahead of the dissemination of investment research, we will not seek to take any advantage before providing it to our clients.
Pepperstone doesn’t represent that the material provided here is accurate, current or complete, and therefore shouldn’t be relied upon as such. The information, whether from a third party or not, isn’t to be considered as a recommendation; or an offer to buy or sell; or the solicitation of an offer to buy or sell any security, financial product or instrument; or to participate in any particular trading strategy. It does not take into account readers’ financial situation or investment objectives. We advise any readers of this content to seek their own advice. Without the approval of Pepperstone, reproduction or redistribution of this information isn’t permitted.

FTSE bullish sideways consolidation capped at 9185The FTSE remains in a bullish trend, with recent price action showing signs of a corrective sideways consolidation within the broader uptrend.
Support Zone: 9066 – a key level from previous consolidation. Price is currently testing or approaching this level.
A bullish rebound from would confirm ongoing upside momentum, with potential targets at:
9185 – initial resistance
9232 – psychological and structural level
9270 – extended resistance on the longer-term chart
Bearish Scenario:
A confirmed break and daily close below 9066 would weaken the bullish outlook and suggest deeper downside risk toward:
9023 – minor support
9000 – stronger support and potential demand zone
Outlook:
Bullish bias remains intact while the FTSE holds above 9066. A sustained break below this level could shift momentum to the downside in the short term.
This communication is for informational purposes only and should not be viewed as any form of recommendation as to a particular course of action or as investment advice. It is not intended as an offer or solicitation for the purchase or sale of any financial instrument or as an official confirmation of any transaction. Opinions, estimates and assumptions expressed herein are made as of the date of this communication and are subject to change without notice. This communication has been prepared based upon information, including market prices, data and other information, believed to be reliable; however, Trade Nation does not warrant its completeness or accuracy. All market prices and market data contained in or attached to this communication are indicative and subject to change without notice.

FTSE uptrend continuation rally resistance at 9185The FTSE remains in a bullish trend, with recent price action showing signs of a corrective sideways consolidation within the broader uptrend.
Support Zone: 9066 – a key level from previous consolidation. Price is currently testing or approaching this level.
A bullish rebound from would confirm ongoing upside momentum, with potential targets at:
9185 – initial resistance
9232 – psychological and structural level
9270 – extended resistance on the longer-term chart
Bearish Scenario:
A confirmed break and daily close below 9066 would weaken the bullish outlook and suggest deeper downside risk toward:
9023 – minor support
9000 – stronger support and potential demand zone
Outlook:
Bullish bias remains intact while the FTSE holds above 9066. A sustained break below this level could shift momentum to the downside in the short term.
This communication is for informational purposes only and should not be viewed as any form of recommendation as to a particular course of action or as investment advice. It is not intended as an offer or solicitation for the purchase or sale of any financial instrument or as an official confirmation of any transaction. Opinions, estimates and assumptions expressed herein are made as of the date of this communication and are subject to change without notice. This communication has been prepared based upon information, including market prices, data and other information, believed to be reliable; however, Trade Nation does not warrant its completeness or accuracy. All market prices and market data contained in or attached to this communication are indicative and subject to change without notice.

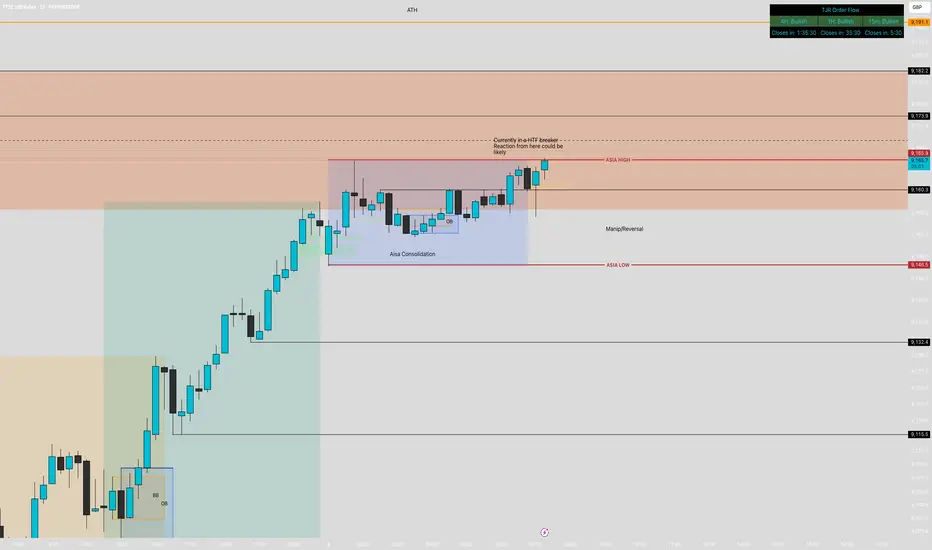
UK100 potential bearishCurrently in a HTF breaker and Order block.
Asia has consolidated for the whole session but seems to be sweeping the liquidity to the upside.
Waiting on a sweep to the upside with a break of structure to the down side. Plenty of liquidity to the downside to collect before we could see new ATH formed.
FTSE SHORTThere is an ABCD pattern on M30
All timeframes are overbought on RSI
There are multiple tops on all timeframes with divergence
Great resistance at this level
Stoploss above 9200

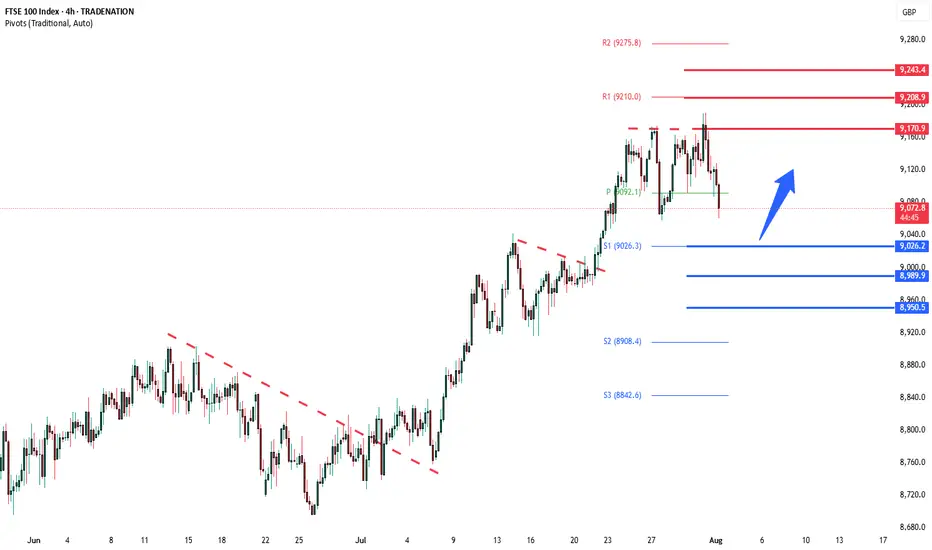
FTSE oversold bounce supported at 9092The FTSE remains in a bullish trend, with recent price action showing signs of a corrective pullback within the broader uptrend.
Support Zone: 9092 – a key level from previous consolidation. Price is currently testing or approaching this level.
A bullish rebound from 9092 would confirm ongoing upside momentum, with potential targets at:
9210 – initial resistance
9243 – psychological and structural level
9276 – extended resistance on the longer-term chart
Bearish Scenario:
A confirmed break and daily close below 9092 would weaken the bullish outlook and suggest deeper downside risk toward:
9062 – minor support
9026 – stronger support and potential demand zone
Outlook:
Bullish bias remains intact while the FTSE holds above 9092. A sustained break below this level could shift momentum to the downside in the short term.
This communication is for informational purposes only and should not be viewed as any form of recommendation as to a particular course of action or as investment advice. It is not intended as an offer or solicitation for the purchase or sale of any financial instrument or as an official confirmation of any transaction. Opinions, estimates and assumptions expressed herein are made as of the date of this communication and are subject to change without notice. This communication has been prepared based upon information, including market prices, data and other information, believed to be reliable; however, Trade Nation does not warrant its completeness or accuracy. All market prices and market data contained in or attached to this communication are indicative and subject to change without notice.

UK100 | Price Pulls Back After Testing 9,179.72 ResistanceThe FTSE 100 recently tagged 9,179.72, a fresh high, before pulling back slightly. Price remains above the 21-period SMA (blue), indicating the uptrend is still intact, though short-term weakness is surfacing. Immediate support sits at 9,036.17.
Support at: 9,036.17 / 8,889.95 🔽
Resistance at: 9,179.72 🔼
🔎 Bias:
🔼 Bullish: Bounce off the 21 SMA and reclaim 9,179.72 confirms continuation.
🔽 Bearish: Break below 9,036.17 opens room to 8,889.95.
📛 Disclaimer: This is not financial advice. Trade at your own risk.

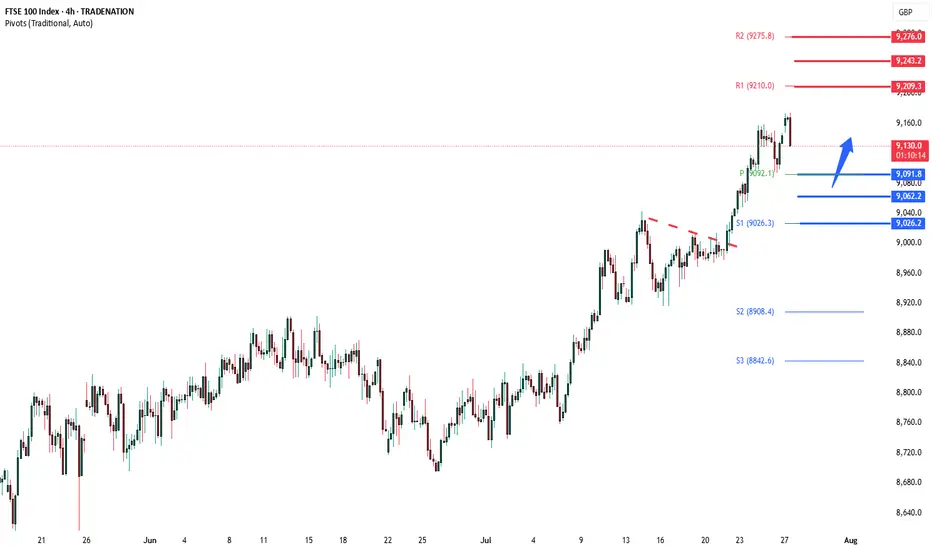
FTSE corrective pullback support at 9092The FTSE remains in a bullish trend, with recent price action showing signs of a corrective pullback within the broader uptrend.
Support Zone: 9092 – a key level from previous consolidation. Price is currently testing or approaching this level.
A bullish rebound from 9092 would confirm ongoing upside momentum, with potential targets at:
9210 – initial resistance
9243 – psychological and structural level
9276 – extended resistance on the longer-term chart
Bearish Scenario:
A confirmed break and daily close below 9092 would weaken the bullish outlook and suggest deeper downside risk toward:
9062 – minor support
9026 – stronger support and potential demand zone
Outlook:
Bullish bias remains intact while the FTSE holds above 9092. A sustained break below this level could shift momentum to the downside in the short term.
This communication is for informational purposes only and should not be viewed as any form of recommendation as to a particular course of action or as investment advice. It is not intended as an offer or solicitation for the purchase or sale of any financial instrument or as an official confirmation of any transaction. Opinions, estimates and assumptions expressed herein are made as of the date of this communication and are subject to change without notice. This communication has been prepared based upon information, including market prices, data and other information, believed to be reliable; however, Trade Nation does not warrant its completeness or accuracy. All market prices and market data contained in or attached to this communication are indicative and subject to change without notice.
BOOM📈 What If You Built a Position Here?
FTSE100. March–April lows.
Three consecutive BUY signals from ELFIEDT RSI + Reversion.
Each one stacking confidence.
Each one building conviction.
Each one right before the entire market exploded higher.
And it wasn’t just FTSE…
🟢 US500? Triggered.
🟢 DOW? Triggered.
🟢 Gold? Sold from the top.
🟢 DAX? Sniped the reversal.
⸻
This was the opportunity to build.
🔁 Layer in across global indices
📊 Trust structure + RSI confluence
📈 Let momentum handle the rest
No panic. No signals every candle.
Just clarity at the bottom — and then the run.
⸻
🧠 What This Teaches Us:
✅ Buy strength, not noise
✅ Use higher timeframe RSI exhaustion as foundation
✅ Let the system compound your edge
This isn’t “catching dips.”
This is building high-probability positions before the world sees it.
⸻
💬 DM “GLOBAL ENTRY” if you’re serious about adding this to your strategy
📲 Follow for multi-market, multi-timeframe setups with edge
🔒 Build better entries. Build better conviction. Build better trades.

Another one?📉 The Drop Looked Scary… But This Indicator Saw the Opportunity.
FTSE100 plunged. Traders panicked.
But our ELFIEDT RSI + Reversion script printed BUY — right at the bottom.
🟢 The Entry? Simple:
✅ RSI dipped far below its comfort zone
✅ Candle tagged our reversion level
✅ Buy signal confirmed in real-time
✅ Price snapped back like a slingshot
👉 Most traders wait for news.
👉 We act on structure, timing, and confluence.
This wasn’t luck.
This was the system — again.
⸻
🔍 HOW TO CATCH MOVES LIKE THIS:
1. Watch for RSI extremes into open volatility
2. Wait for overshoot into reversion band
3. Let the indicator confirm with a green arrow
4. Enter. Set stop just below signal candle
5. Let momentum do the work 💥
⸻
💡 You could’ve been LONG from the low.
💰 You could’ve caught 40+ points in minutes.
Want this on your chart?
🔓 DM “UK ENTRY” to unlock access.
📈 Follow for setups that actually work.

FTSE rally resistance at 9150The FTSE remains in a bullish trend, with recent price action showing signs of a corrective pullback within the broader uptrend.
Support Zone: 9045 – a key level from previous consolidation. Price is currently testing or approaching this level.
A bullish rebound from 9045 would confirm ongoing upside momentum, with potential targets at:
9150 – initial resistance
9172 – psychological and structural level
9200 – extended resistance on the longer-term chart
Bearish Scenario:
A confirmed break and daily close below 9150 would weaken the bullish outlook and suggest deeper downside risk toward:
9018 – minor support
8980 – stronger support and potential demand zone
Outlook:
Bullish bias remains intact while the FTSE holds above 9150. A sustained break below this level could shift momentum to the downside in the short term.
This communication is for informational purposes only and should not be viewed as any form of recommendation as to a particular course of action or as investment advice. It is not intended as an offer or solicitation for the purchase or sale of any financial instrument or as an official confirmation of any transaction. Opinions, estimates and assumptions expressed herein are made as of the date of this communication and are subject to change without notice. This communication has been prepared based upon information, including market prices, data and other information, believed to be reliable; however, Trade Nation does not warrant its completeness or accuracy. All market prices and market data contained in or attached to this communication are indicative and subject to change without notice.

uk100 crazy pump - time to SHORTTeam, those who SHORT UK100, make sure stop loss at 9175
Target 1 at 9135-32
Target 2 at 9109-16
Last few months, UK100 has been aggressively cutting rate due to expose in recession. But now they are out of the wood.
The market has been over pricing and over value.
We expect the market to come down.

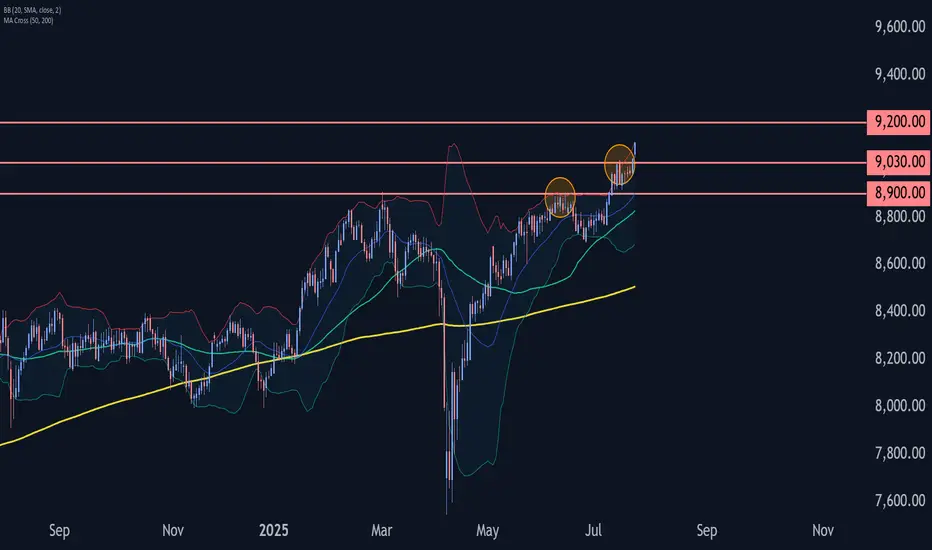
FTSE 100 Wave Analysis – 23 July 2025- FTSE 100 broke resistance level 9030.00
- Likely to rise to resistance level 9200.00
FTSE 100 Index recently broke above the resistance level 9030.00, which stopped the previous minor impulse wave 1 at the start of July.
The breakout of the resistance level 9030.00 continues the active minor impulse wave 3 – which belongs to the intermediate impulse wave (3) from the end of July.
Given the clear daily uptrend, FTSE 100 Index can be expected to rise to the next resistance level 9200.00 (target price for the completion of the active impulse wave 3).
FTSE100 breakout zone now new support at 9030The FTSE remains in a bullish trend, with recent price action showing signs of a continuation breakout within the broader uptrend.
Support Zone: 9030 – a key level from previous consolidation. Price is currently testing or approaching this level.
A bullish rebound from 9030 would confirm ongoing upside momentum, with potential targets at:
9107 – initial resistance
9140 – psychological and structural level
9170 – extended resistance on the longer-term chart
Bearish Scenario:
A confirmed break and daily close below 9030 would weaken the bullish outlook and suggest deeper downside risk toward:
8980 – minor support
8920 – stronger support and potential demand zone
Outlook:
Bullish bias remains intact while the FTSE holds above 9030. A sustained break below this level could shift momentum to the downside in the short term.
This communication is for informational purposes only and should not be viewed as any form of recommendation as to a particular course of action or as investment advice. It is not intended as an offer or solicitation for the purchase or sale of any financial instrument or as an official confirmation of any transaction. Opinions, estimates and assumptions expressed herein are made as of the date of this communication and are subject to change without notice. This communication has been prepared based upon information, including market prices, data and other information, believed to be reliable; however, Trade Nation does not warrant its completeness or accuracy. All market prices and market data contained in or attached to this communication are indicative and subject to change without notice.

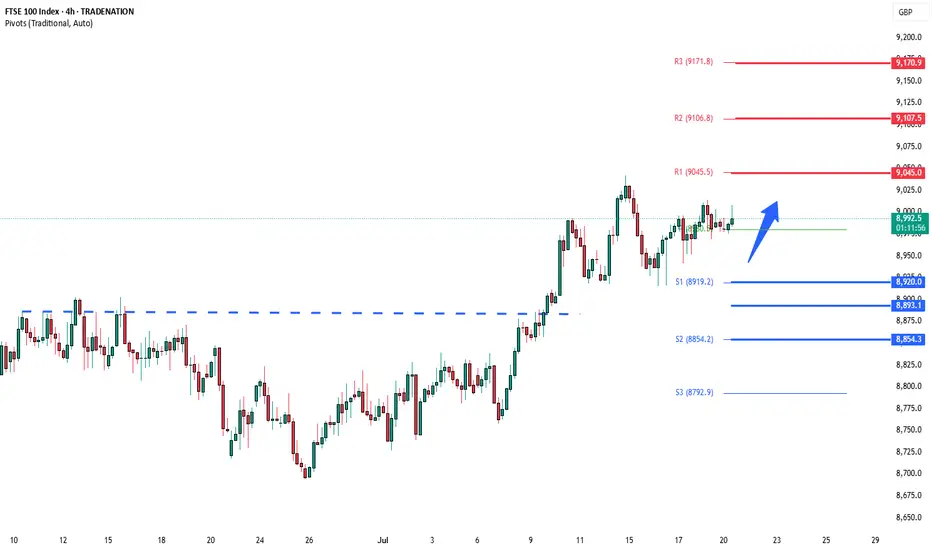
FTSE bullish consolidation resistance at 9045The FTSE remains in a bullish trend, with recent price action showing signs of a corrective pullback within the broader uptrend.
Support Zone: 8020 – a key level from previous consolidation. Price is currently testing or approaching this level.
A bullish rebound from 8920 would confirm ongoing upside momentum, with potential targets at:
9045 – initial resistance
9107 – psychological and structural level
9170 – extended resistance on the longer-term chart
Bearish Scenario:
A confirmed break and daily close below 8920 would weaken the bullish outlook and suggest deeper downside risk toward:
8893 – minor support
8854 – stronger support and potential demand zone
Outlook:
Bullish bias remains intact while the FTSE holds above 8920. A sustained break below this level could shift momentum to the downside in the short term.
This communication is for informational purposes only and should not be viewed as any form of recommendation as to a particular course of action or as investment advice. It is not intended as an offer or solicitation for the purchase or sale of any financial instrument or as an official confirmation of any transaction. Opinions, estimates and assumptions expressed herein are made as of the date of this communication and are subject to change without notice. This communication has been prepared based upon information, including market prices, data and other information, believed to be reliable; however, Trade Nation does not warrant its completeness or accuracy. All market prices and market data contained in or attached to this communication are indicative and subject to change without notice.