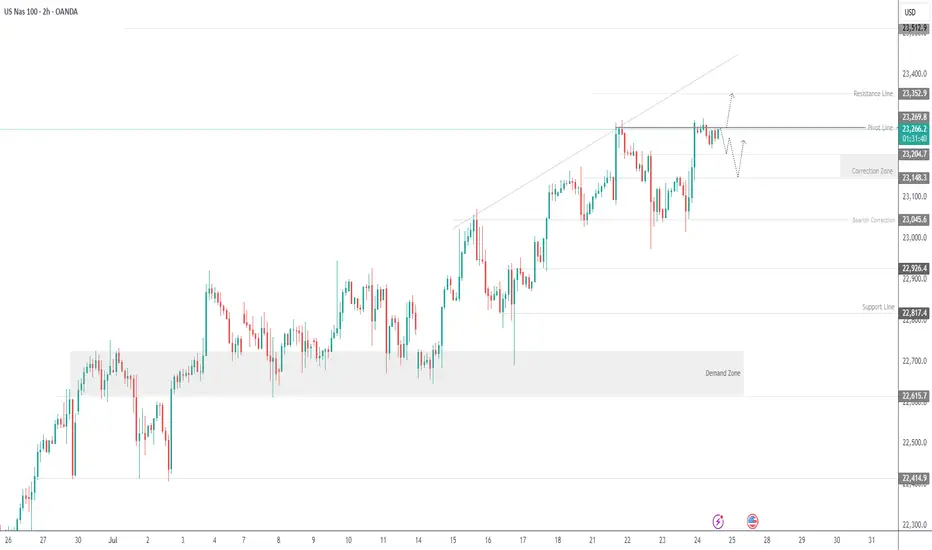
NAS100 Bigger Picture. Uptrend to be resumedLooking at the current structure through the lens of a trend trading approach, what we saw on NAS100 is more than a simple price bounce, it’s a trend continuation trading within a high-volatility environment. As price is approaching a key resistance level, how price is behaving around this dynamic trendline will be key.
This recent retracement and rejection happening near what we can call a demand zone cluster, was confirmed by a beautiful bounce off the support range. And right now price is respecting the upper and lower bounds nicely.
What happens next? Price is showing signs of bullish exhaustion, but the higher-timeframe structure supports a continuation.
My projected target is towards the upper resistance line, that’s my 23,100 zone as shown.
NQCUSD trade ideas

Upward momentum of Nasdaq is weakening, likely to fall to supporUpward momentum of Nasdaq is weakening, likely to fall to support level of 22k

I am 100 % short spy and qqq I am BULLISH DXY the chart posted is now setup for the cycle top On several cycles and we have just popped the Shiller p/e above 3866 second highest reading ever . Cycle are into a peak that was due 7/5 to 7/14 So why are we now turning down .? wait the energy from one of the largest solar storms is the time for the transition it is also a new moon . my spirals have called for the top as it did in 12/5 and 2/17 . I see a min drop of over 8 and could see well over 11.8 within the next 90 days . best of trades WAVETIMER

NAS100 steadies at high levels, pay attention nextThe most recent move on NAS100 saw a sharp drop that briefly recovered, likely triggering stops before aggressively reversing from the lower boundary of the newly projected channel. This isn't a cause for concern, on the contrary, it's another opportunity to get involved.
That is because this drop and recovery is a common behavior in strong uptrends before resuming bullish momentum.
The market is likely in the early stages of a new impulsive leg to the upside right here.
We could either have short-term consolidation or pullback, then a continuation toward the upper channel boundary or straight upwards, and with NAS100, the latter is more plausible.
My target will be at 23,300 around the upper boundary of the projected channel resistance.
In this context, the market remains bullish clearly. The most interesting aspect is the emotional flush on the last drop, trapping sellers before fueling what could be another big leg up.

Nasdaq 100: Market Optimism Builds Ahead of Big Tech EarningsNasdaq 100: Market Optimism Builds Ahead of Big Tech Earnings
The earnings season is gaining momentum. This week, major technology companies such as Alphabet (GOOGL) and Tesla (TSLA) are scheduled to release their quarterly results.
Given that 85% of the 53 S&P 500 companies that have already reported have exceeded analysts’ expectations, it is reasonable to assume that market participants are also anticipating strong results from the big tech names. The Nasdaq 100 index (US Tech 100 mini on FXOpen) set an all-time high last week — a level that may be surpassed (potentially more than once) before the end of August.
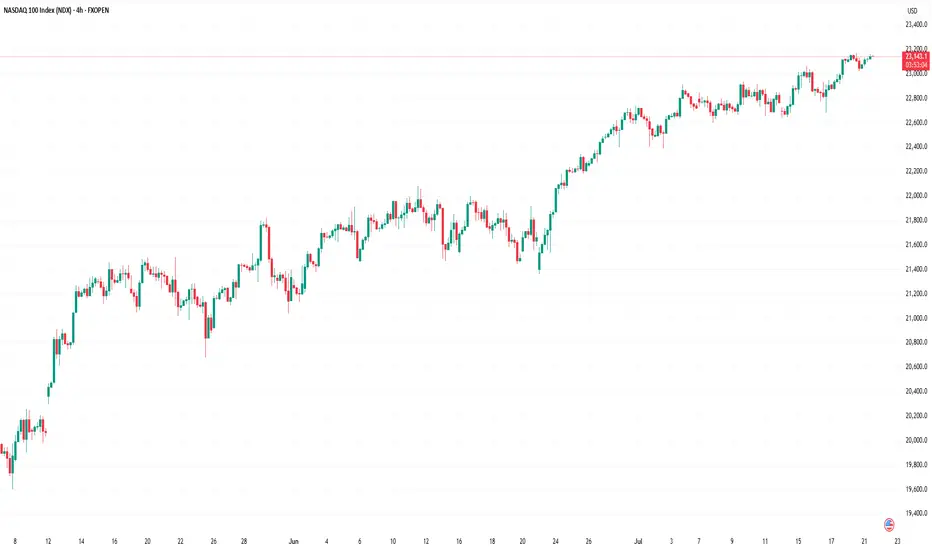
Technical Analysis of the Nasdaq 100 Chart
Price movements have formed an upward channel (marked in blue), with the following dynamics observed:
→ The bearish signals we highlighted on 7 July did not result in any significant correction. This may be interpreted as a sign of a strong market, as bearish momentum failed to materialise despite favourable technical conditions.
→ Buyers have shown initiative by gaining control at higher price levels (as indicated by the arrows): the resistance at 22,900 has been invalidated, while the 23,050 level has flipped to become support.
→ A long lower shadow near the bottom boundary of the channel (circled on the chart) underscores aggressive buying activity.
Should the earnings and forward guidance from major tech firms also come in strong, this could further reinforce the sustainable bullish trend in the US equity market.
This article represents the opinion of the Companies operating under the FXOpen brand only. It is not to be construed as an offer, solicitation, or recommendation with respect to products and services provided by the Companies operating under the FXOpen brand, nor is it to be considered financial advice.
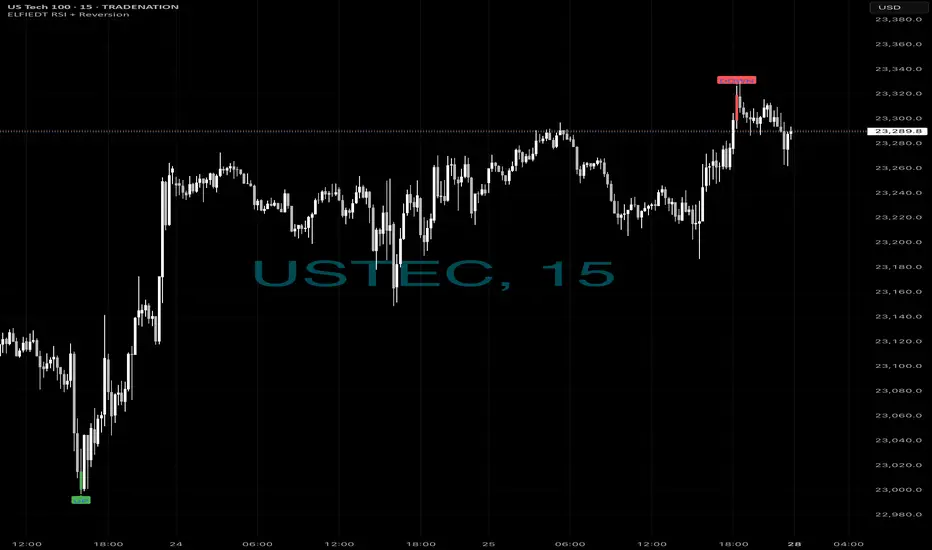
Longs then short - $$$🚀 Caught the Bottom. 🔻 Sold the Top.
Same chart. Same system. Same day.
While most traders were guessing,
ELFIEDT RSI + Reversion was sniping both ends on the US Tech 100.
📍 Long Signal:
At the dead low — green UP arrow fired.
The reversal followed instantly. Momentum exploded.
📍 Short Signal:
At the top of the rally — red DOWN printed.
Perfect spot. Price reversed hard within 1 candle.
⸻
🎯 How It Works:
✔️ Combines RSI overshoots + volatility reversion
✔️ Filters false signals using structure + time of day
✔️ Works on any index or FX pair
✔️ Real-time signals. No lag. No repainting.
⸻
💡 These weren’t “lucky trades.”
They were high-probability SETUPS.
Backed by logic. Confirmed by RSI extremes.
And now? Proven on the chart.
⸻
👉 Want to catch the next reversal like this?
💬 DM me “USTEC” or drop a 🚀
🔒 Access is limited to serious traders only.
📲 Follow for daily setups & training.
shortsif this short don't hit il be looking to resell at 23270, for now seling to 22485 ,if this short works out il be selling till 20 149

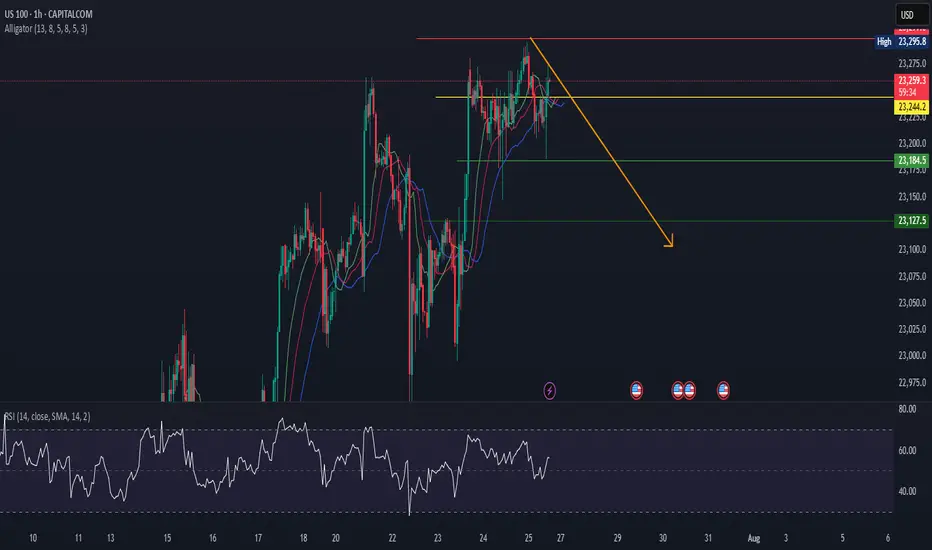
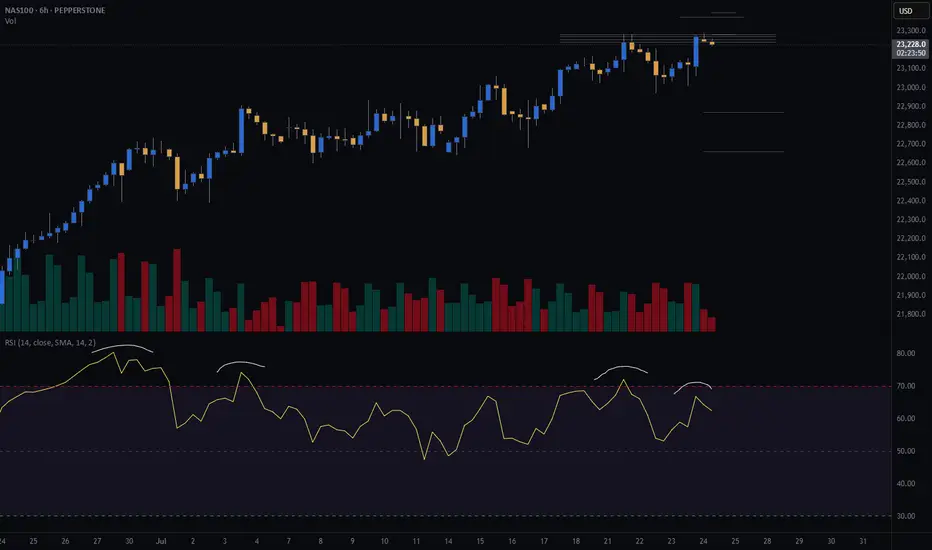
US100Us100 is in reversal MOde.
Big bearish divergence also shown in RSI.
Alligator alos indicates trend will go down from here.
we sell at CMP>
Us100 short position 24/07/2025English : According to our analysis, we anticipate a bearish scenario.
Morocan Darija : kanchofo d'apres l'analyse dyalna antsanaw hboot
ATENTION : I only share my ideas, not signals
NSDQ100 pushing to new ATH?Thursday was a slightly positive session for equities, with the NASDAQ 100 rising +0.18% to close at a fresh record high, driven by strong economic data. However, overall market action was subdued, with the S&P 500’s trading range the narrowest since February (0.35%).
Notably, the equal-weighted S&P 500 fell -0.33%, highlighting underlying weakness outside mega-cap tech.
A key drag on the NASDAQ came from Tesla (-8.20%), which slumped after disappointing earnings. This weighed on the Magnificent 7, which declined -0.21% despite gains in the other six members.
On the macro front, the US dollar strengthened as Donald Trump downplayed his dispute with Fed Chair Jerome Powell, though continued to pressure the Fed on interest rates. Meanwhile, the FCC approved Paramount’s merger with Skydance, signaling a green light for M&A activity in media despite political tensions.
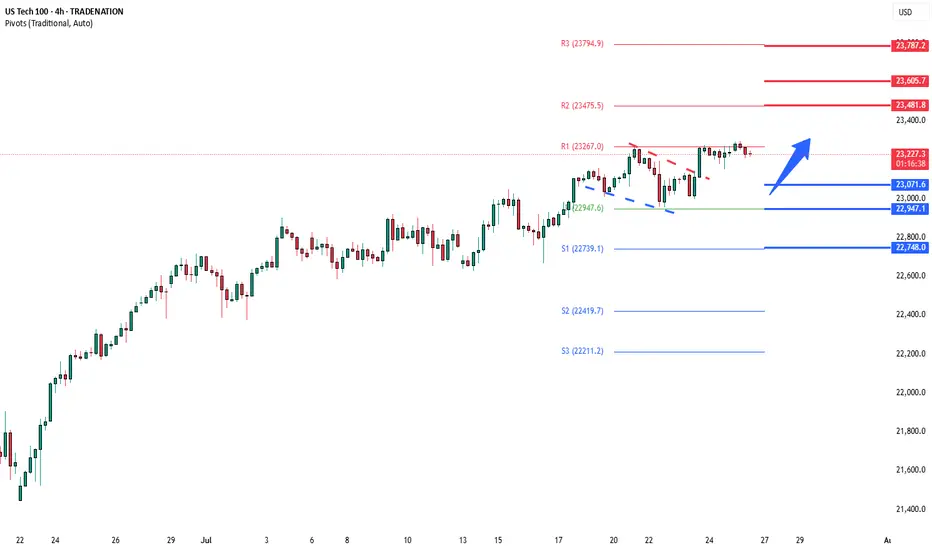
Conclusion – NASDAQ 100 Trading View:
The NASDAQ 100 remains technically bullish, setting new highs amid resilient economic data. However, breadth is weakening, and headline risk—especially around earnings (e.g., Tesla)—could trigger short-term volatility. Traders should stay long with caution, watching for sector rotation or profit-taking near highs, and monitor Fed-related rhetoric for macro-driven moves.
Key Support and Resistance Levels
Resistance Level 1: 23480
Resistance Level 2: 23600
Resistance Level 3: 23790
Support Level 1: 23070
Support Level 2: 22950
Support Level 3: 22750
This communication is for informational purposes only and should not be viewed as any form of recommendation as to a particular course of action or as investment advice. It is not intended as an offer or solicitation for the purchase or sale of any financial instrument or as an official confirmation of any transaction. Opinions, estimates and assumptions expressed herein are made as of the date of this communication and are subject to change without notice. This communication has been prepared based upon information, including market prices, data and other information, believed to be reliable; however, Trade Nation does not warrant its completeness or accuracy. All market prices and market data contained in or attached to this communication are indicative and subject to change without notice.
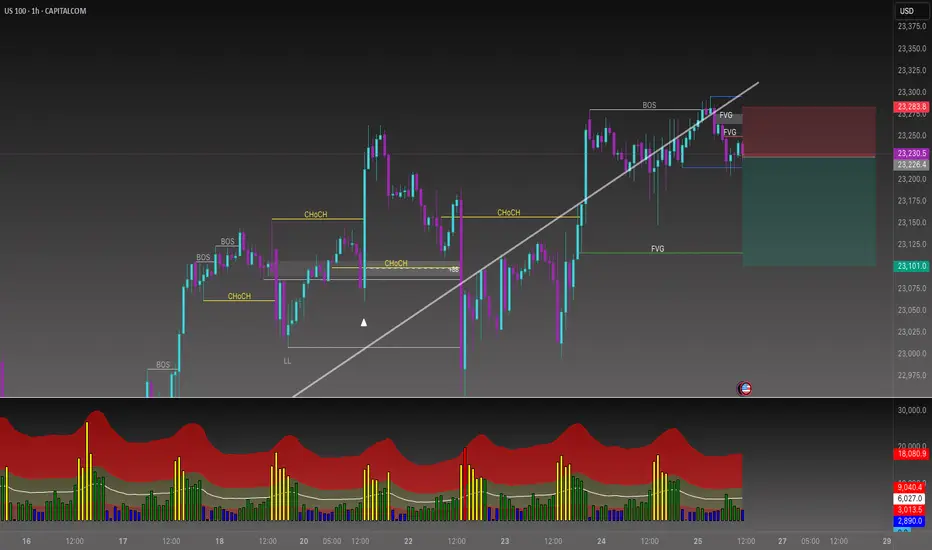
Do you want to keep buying NAS100?📉 Sell-Side Bias Activated
After PEPPERSTONE:NAS100 confirming the trend shift with a clean Break of Structure (BOS) and a strong rejection from the FVG (Fair Value Gap) zone, price failed to hold above 23,275.
This move validated the liquidity sweep and imbalance fill. Multiple FVGs stacked above suggest premium pricing and further downside potential.
🧠 I’m now watching for continuation setups toward discount zone. Especially below 23,100 and possibly targeting the lower FVG region.
This is a classic smart money play, manipulation, BOS, FVG retest, and selloff.
🔻Bias: Bearish
🎯 Target: Liquidity pools below 23,100
🛑 Invalidated above 23,280 (structure reclaim)
NASDAQ100 continue its strength due to the strong earning seasonFundamental:
USTEC (NASDAQ100) continues its strength, propelled by robust Alphabet (GOOG) earnings that buoyed technology companies. Cloud services recorded the largest growth at 32% YoY, primarily driven by AI. Concurrently, the company plans to allocate $85 bln to capital expenditure in 2025 for AI, an increase from $75 bln, signaling continued surging demand for AI infrastructure.
In addition, recent US economic data indicated strong consumption and optimism, with the July Services PMI expanding to 55.2 from 52.9 in the previous month. Initial Jobless Claims also fell to 217k, the lowest in 14 weeks, reinforcing optimism regarding the labor market, alongside stronger-than-expected Nonfarm Payrolls from early July.
Inflation data showed a minor impact from tariffs, and tariff negotiations have progressed favorably. Trade deals have been secured with Vietnam, Indonesia, Japan, and the Philippines, and potential trade agreements with the Eurozone and India are anticipated before the deadline.
Major earnings releases are slated for next week, including MSFT, META, and QCOM on July 30. AMZN and APPL's results the following day could provide a clearer picture of USTEC's overall earnings.
Meanwhile, USTEC's forward P/E currently stands at 27x, aligning with its 5-year average despite reaching a new record high, suggesting further upside potential.
Technical:
The index is trading above its EMAs, which are extending, signaling a continuation of the rally.
If USTEC sustains its momentum, the index may reach 24000 upon breaking above the potential resistance at 23400.
Conversely, a pullback near the swing high may suggest a retest of the support at 23000.

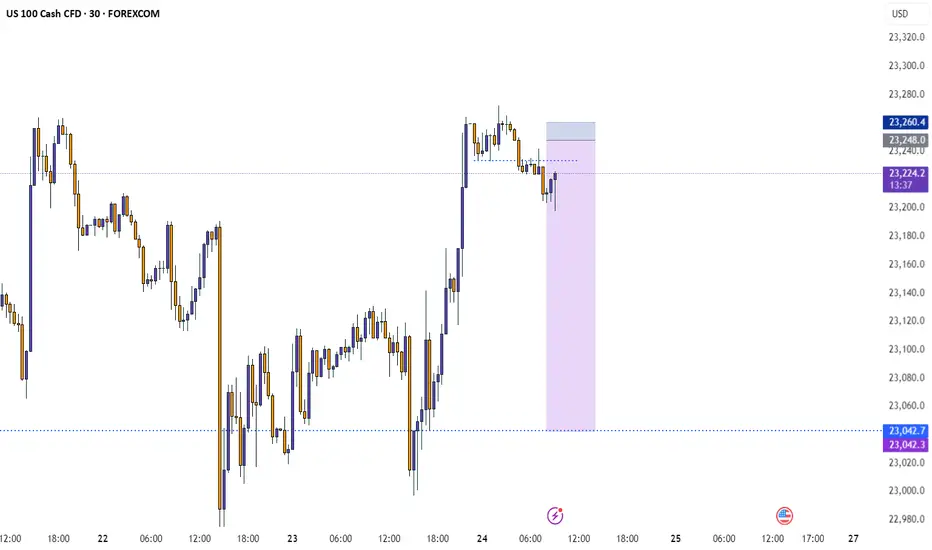
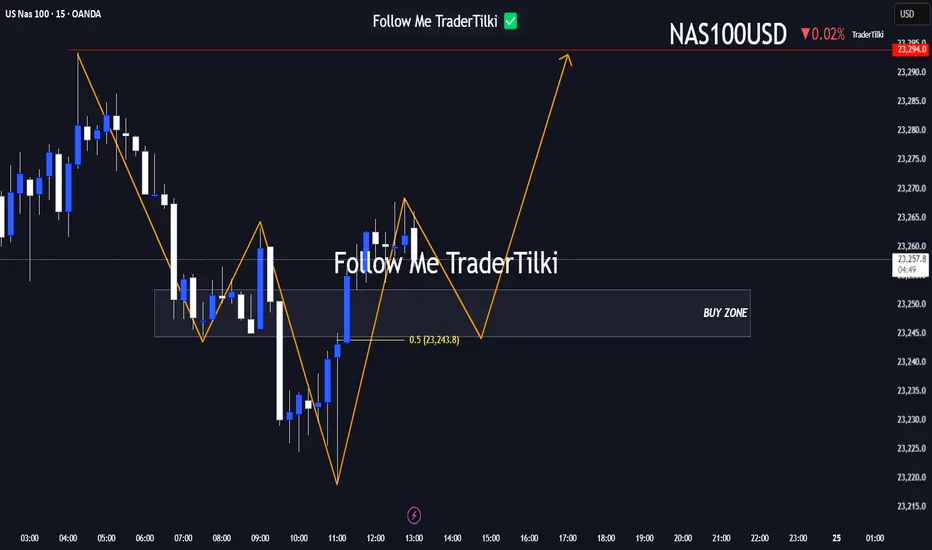
Here’s a fresh Nasdaq100 analysis I’ve put together for you.Hey Guys,
Here’s a fresh Nasdaq100 analysis I’ve put together for you.
I’ve marked the buy zone between 23,252 and 23,240. If price dips into that range, I’m anticipating a potential move upward toward 23,294.
Your likes and support are my biggest source of motivation to keep sharing these insights.
Huge thanks to everyone backing me with a thumbs-up!
NASDAQ (CASH100) SHORT - Head and shoulders H1Risk/reward = 3.8
Entry price = 23 167.9
Stop loss price = 23 232.8
Take profit level 1 (50%) = 22 943
Take profit level 2 (50%) = 22 878
Still waiting on confirmation on some variables in checklist

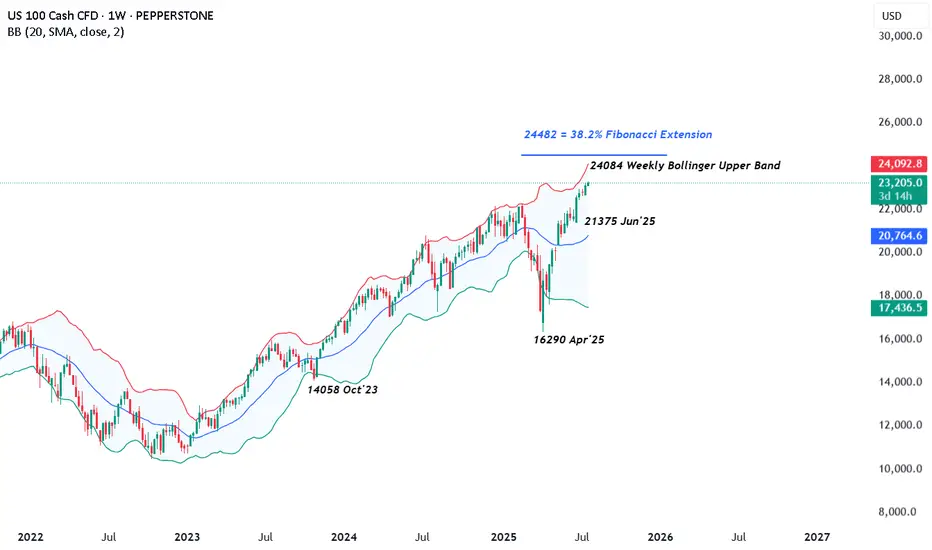
US 100 – All Eyes on Tariffs, Trade Deals and Tech EarningsRenewed demand for US assets has been evident throughout July so far and this has helped to lift the US 100 index to new heights with gains of over 2.5% across the month. The technology heavy index has risen from opening levels around 22650 on July 1st, then recorded several all time highs, before eventually finding some selling interest after printing the most recent record peak at 23282 yesterday afternoon.
This upside has been supported by fresh trader hopes of interest rate cuts, after Federal Reserve (Fed) policymaker Waller suggested last Thursday that he would consider a 25bps (0.25%) reduction at their next meeting on July 30th, despite Fed Chairman Powell maintaining the view that the US central bank are currently pursuing a wait and see approach, as they look for more information on inflation and growth trends to assist them to determine the on-going impact of tariffs.
Part of the reason for the Fed’s reluctance to cut rates has also been the resilience of US economic data. With US consumers still spending and employment yet to feel the negative impact of President Trump’s tariff policies, leading to a potential positive knock-on impact for growth and corporate earnings, when considered against prior downbeat market expectations.
This all leads nicely onto what could be a key sentiment driver for the direction of the US 100 this week, the start of earnings updates from the ‘Magnificent Seven’ tech companies, two of which, Alphabet and Tesla, report their earnings after the market close tomorrow. These are then followed by Microsoft and Meta on Wednesday July 30th, then Amazon and Apple on Thursday July 31st.
Traders will be keen to judge actual earnings against market expectations, alongside updates on AI spending and investment, forward guidance on the impact of tariffs and more specifically for Tesla, the time Elon Musk may dedicate to the company, rather than the distractions of politics.
The technical outlook could also be important.
Technical Update: Can The Positive Trend Extend Further?
There appears to be no clear-cut signs of a negative sentiment shift in the US 100 index yet, as fresh buying has continued to develop above support provided by the rising daily Bollinger mid-average, currently at 22785 (see chart below).
Of course, there is no guarantee this positive pattern of higher price highs and higher price lows will continue, especially given the on-going trade discussion between the US and its allies, as well as the earnings announcements from Alphabet and Tesla.
However, it can be useful for traders to prepare for any future volatility by assessing potential support and resistance levels that could impact the direction of the US 100 moving forward.
Potential Support Levels:
It is possible the rising Bollinger mid-average, currently at 22785, represents a first support focus for traders, and as such, closing breaks below this level might lead to a more extended phase of price weakness.
Such moves could see a deeper sell-off towards 22533, which is equal to the 38.2% Fibonacci retracement of June 23rd to July 18th 2025 price strength.
Potential Resistance Levels:
With fresh price strength emerging with the US 100 index above the rising Bollinger mid-average, a positive price pattern of higher highs and higher lows, may still be evident. This reflects buyers are currently willing to pay higher prices, each time a setback materialises.
However, to maintain this uptrend pattern in price, the focus could now be on resistance provided by the July high at 23282 (July 21st). Closing breaks above this level might be required to suggest further strength, towards the next potential resistance level at 24084, which is the weekly Bollinger upper band, even 24482, which is equal to the 38.2% Fibonacci extension.
The material provided here has not been prepared in accordance with legal requirements designed to promote the independence of investment research and as such is considered to be a marketing communication. Whilst it is not subject to any prohibition on dealing ahead of the dissemination of investment research, we will not seek to take any advantage before providing it to our clients.
Pepperstone doesn’t represent that the material provided here is accurate, current or complete, and therefore shouldn’t be relied upon as such. The information, whether from a third party or not, isn’t to be considered as a recommendation; or an offer to buy or sell; or the solicitation of an offer to buy or sell any security, financial product or instrument; or to participate in any particular trading strategy. It does not take into account readers’ financial situation or investment objectives. We advise any readers of this content to seek their own advice. Without the approval of Pepperstone, reproduction or redistribution of this information isn’t permitted.
NASDAQ Rebounding on its 1H MA50.Nasdaq (NDX) rebounded today on its 1H MA50 (blue trend-line), third time since Friday's and Thursday's bounce. A Channel Up is emerging and based on the 4H RSI it is a medium-term bullish reversal off the Pivot trend-line, similar to June 20 - 30.
As you can see, that Channel Up targeted the 2.618 Fibonacci extension before breaking below the 1H MA50 to start a lengthy consolidation. Based on that, we are targeting 23650 (Fib 2.618 ext) on the short-term.
-------------------------------------------------------------------------------
** Please LIKE 👍, FOLLOW ✅, SHARE 🙌 and COMMENT ✍ if you enjoy this idea! Also share your ideas and charts in the comments section below! This is best way to keep it relevant, support us, keep the content here free and allow the idea to reach as many people as possible. **
-------------------------------------------------------------------------------
Disclosure: I am part of Trade Nation's Influencer program and receive a monthly fee for using their TradingView charts in my analysis.
💸💸💸💸💸💸
👇 👇 👇 👇 👇 👇

NASDAQ (CASH100) SHORT - double top H6Risk/reward = 4.3
Entry price = 23 282
Stop loss price = 23 398
Take profit level 1 (50%) = 22 871
Take profit level 2 (50%) = 22 663
If current H6 goes back into range, I will open short position.
All variables on checklist have been met.
I was out last night so I missed my initial entry. Hoping for a second chance.
Hopefully this short works because the last few higher time frame short setups have failed, although because of exit plan I have made very little losses.
NASDAQ | BearishNASDAQ has Printed double top as well as broken the bullish trend by printing two lower highs and lower lows.It is likely to continue the bearish trend since NASDAQ has already witnessed quite a long bullish rally.

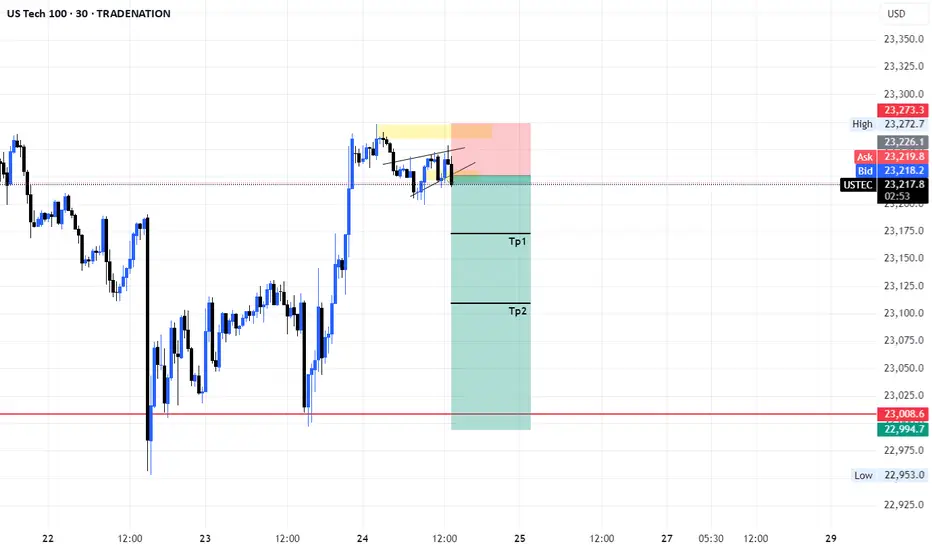
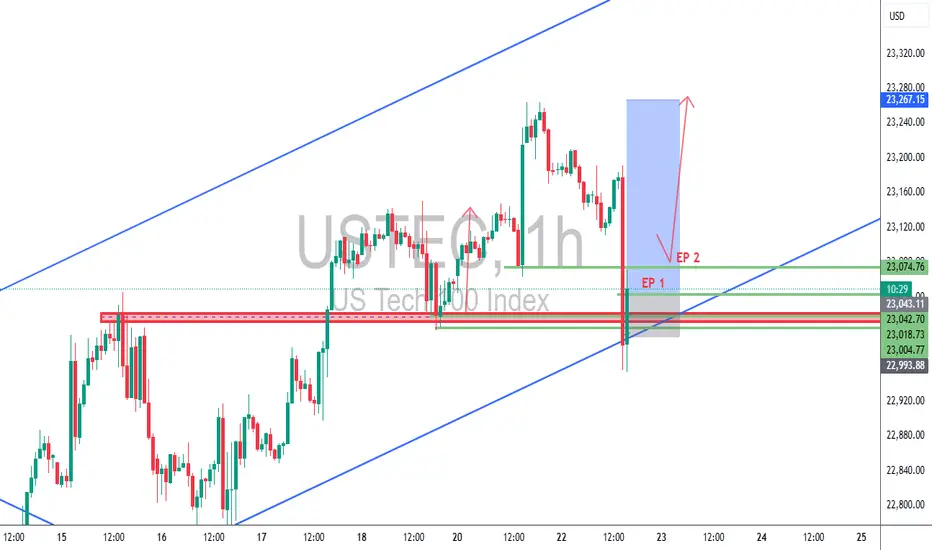
USTEC 1H – Dual Entry Precision | TCB Trend Phase SetupUSTEC 1H – Dual Entry Precision | TCB Trend Phase Setup
Market remained bullish with clear channel structure. After a pullback into the previous breakout zone, price swept liquidity and wicked below, offering two refined entries (EP 1 & EP 2) inside the demand zone.
🔸 EP 1 – Aggressive entry on first touch
🔸 EP 2 – Confirmation entry after rejection
🔸 SL placed below structural liquidity sweep
🔸 Target: Mid-channel + price inefficiency fill above
Trade Summary
🧠 Trend Phase entry with TCB logic
📌 Demand zone = Key structure
⏱️ Low drawdown
💥 RRR ~1:3
📈 TP in motion (or hit, if price reached 23,267)
📎 #Hashtags:
#USTEC #US100 #Nasdaq #SmartMoneyConcepts #SniperTrader #ForexTrading #PriceActionTrading #TCBSetup #TrendTrading #LiquiditySweep #RiskReward #TradingViewAnalysis
NAS100 ShortSecond entry same area to enter
Elite Analysis
Price came to structural liquidity
Targeted a 5m OB for execution
TP's targeted at lower liquidity pools

USNAS100 - Tech Index Pulls Back After Testing 23,295USNAS100 | OVERVIEW
The index came close to registering a new ATH at 23,295 before pulling back slightly.
Today, it appears to be in a bearish correction phase toward 23,200 and 23,150, as long as the price trades below 23,270.
Market sentiment may remain cautious, especially with no major earnings reports scheduled before the open, although Intel’s report after the close could have a notable impact.
A 1H close above 23,290 would invalidate the correction and open the way toward 23,350 and 23,500.
Key Levels:
Support: 23,200 · 23,150 · 23,050
Resistance: 23,350 · 23,520
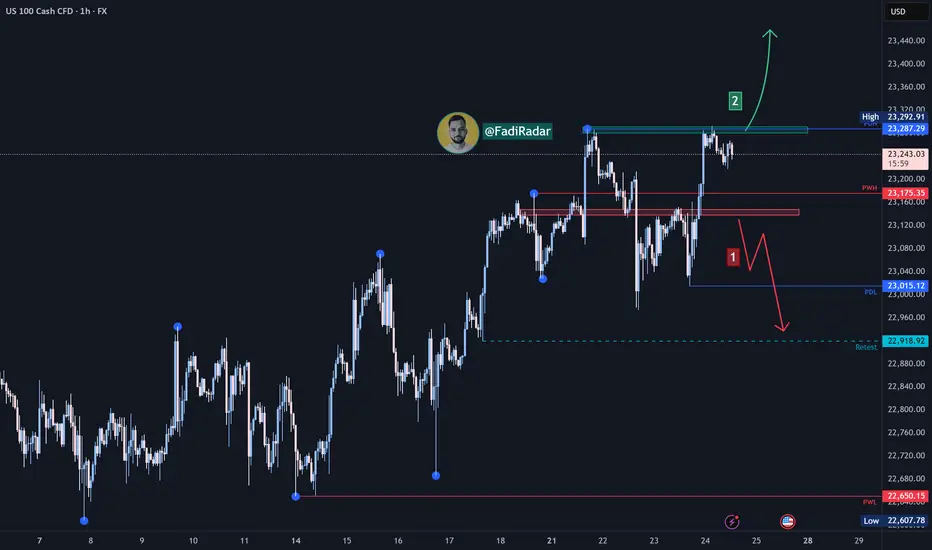
Nasdaq Index Analysis (US100 / NASDAQ):The Nasdaq index continues its upward trend in the medium to long term. Yesterday, it tested the 23,000 USD level and bounced higher toward 23,290 USD.
1️⃣ If the price breaks below 23,100 USD and closes beneath it, we may see a decline toward 23,000 USD, followed by 22,920 USD.
2️⃣ However, if the price holds above 23,290 USD, further bullish momentum could lead to a new high around 23,400 USD.
⚠️ Disclaimer:
This analysis is not financial advice. Please monitor the markets and analyze the data carefully before making any investment decisions.
SellRejection Level
Daily Volume
Market Structure Shift
London Session
Trend Line Break
Untapped Order Point