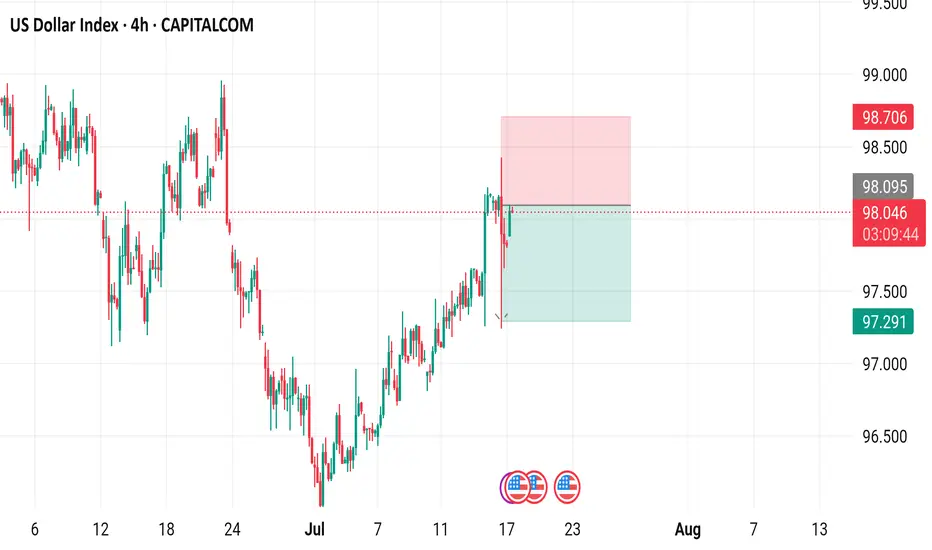
US Dollar Index (DXY) - 4 Hour Chart4-hour performance of the US Dollar Index (DXY) from CAPITALCOM, showing a current value of 98.040 with a 0.23% increase (+0.222). The chart includes recent buy and sell signals at 98.094 and 98.040, respectively, with a highlighted resistance zone around 98.706-99.000 and a support zone around 97.291-98.040. The timeframe covers data from early July to mid-August 2025.
USXUSD trade ideas
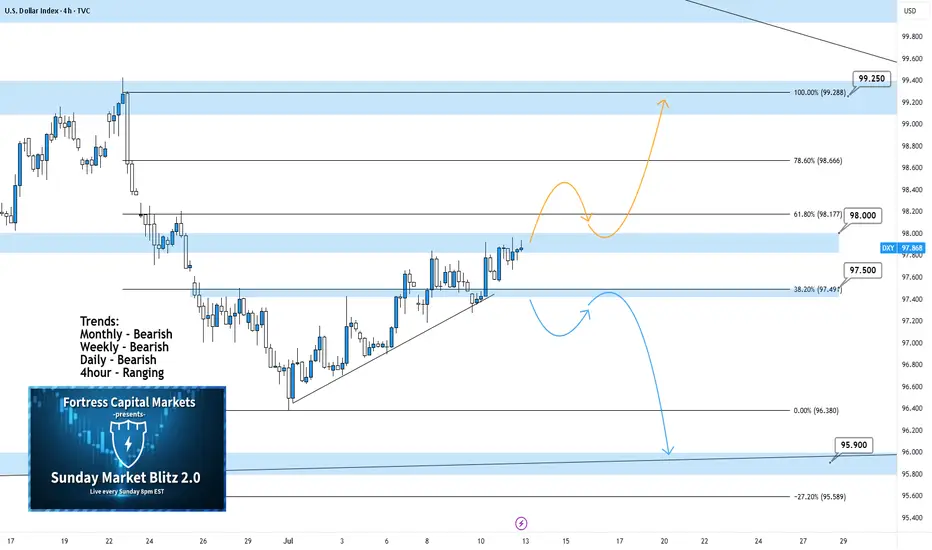
DXY 4Hour TF - July 13th, 2025DXY 7/13/2025
DXY 4hour Neutral Idea
Monthly - Bearish
Weekly - Bearish
Dailly - Bearish
4hour - Ranging
Keep in mind, we analyze and follow DXY more so as an indicator. The USD makes up for a large portion of trade so it makes sense to analyze it.
Going into this week we can see DXY made an attempt to push higher. Where it closed on Friday is a major zone around 98.000. We’re still majorly bearish on higher time frames so we will keep that in mind throughout this week.
As always, we will mark up two potential paths for this week, they are as follows:
Bullish Breakout - The two main zones we want to bring out attention to are 98.000 resistance and 97.500 support. We will have to wait until price action leaves this area to spot a high quality setup. Look for a convincing push above 98.000 resistance followed by a retest of 98.000 but as support. Look for a higher low to form with bullish confirmation to long on.
Bearish Continuation- Going bearish is still very possible we just need to clear 97.500 support first. Look for a break below 97.500 with a confirmed lower high and convincing bearish setups to short on.
DXY: Next Move Is Down! Short!
My dear friends,
Today we will analyse DXY together☺️
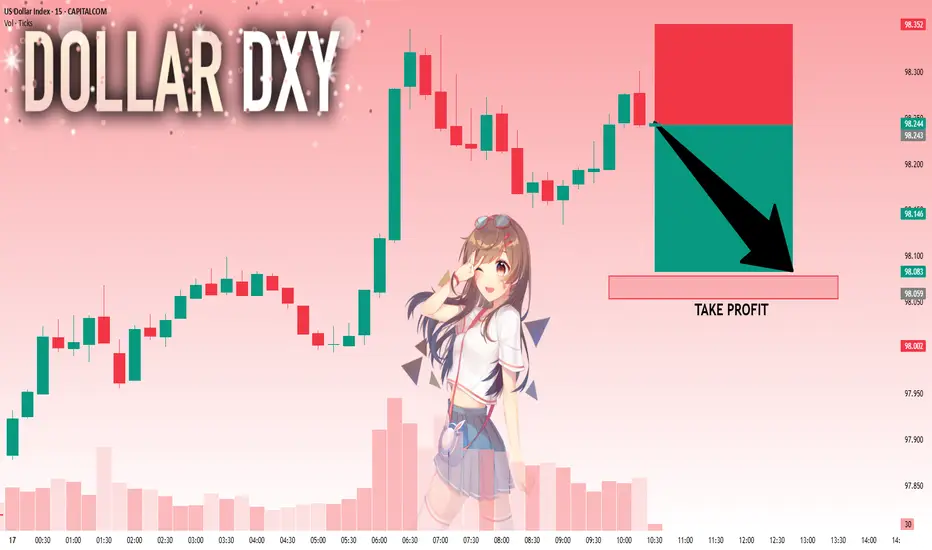
The price is near a wide key level
and the pair is approaching a significant decision level of 98.243 Therefore, a strong bearish reaction here could determine the next move down.We will watch for a confirmation candle, and then target the next key level of 98.078..Recommend Stop-loss is beyond the current level.
❤️Sending you lots of Love and Hugs❤️
possibility bof uptrendIt is expected that some fluctuation and correction will form within the current resistance zone, then there is a possibility of a trend change and the start of a downtrend.
As long as the index does not stabilize above the green resistance zone, a downtrend is likely.

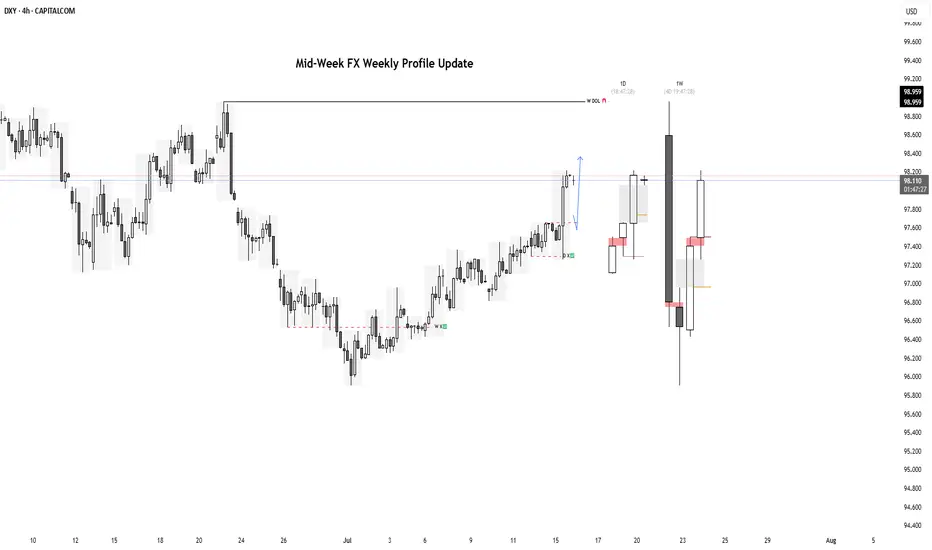
Mid-Week FX Profile UpdatesMid-Week FX Profile Update with Daily and Weekly Overlays
USDJPY
EURUSD
GBPUSD
GOLD
DXY: potentially aiming for January 2025 highsAlthough we do not Trade the dollar specifically, it is a good barometer the feel out other assets.
It seems like DXY reached a MONTHLY LEVEL. I expect price to form a FVG within this rectangle on the daily level. Which will eventually create a GAP on one of the currencies. Will follow up when this happens.
IMO reversed and is going to reach the daily level quick. This will mean, POUND, EURO DOWN.

DXY Bearish The DXY is currently positioned at a critical level, experiencing significant volatility. It appears to be transitioning between key zones, with a potential shift from the 98.058–97.917 range into a bearish move. If confirmed, the index could target lower levels around 95.5 to 94.00

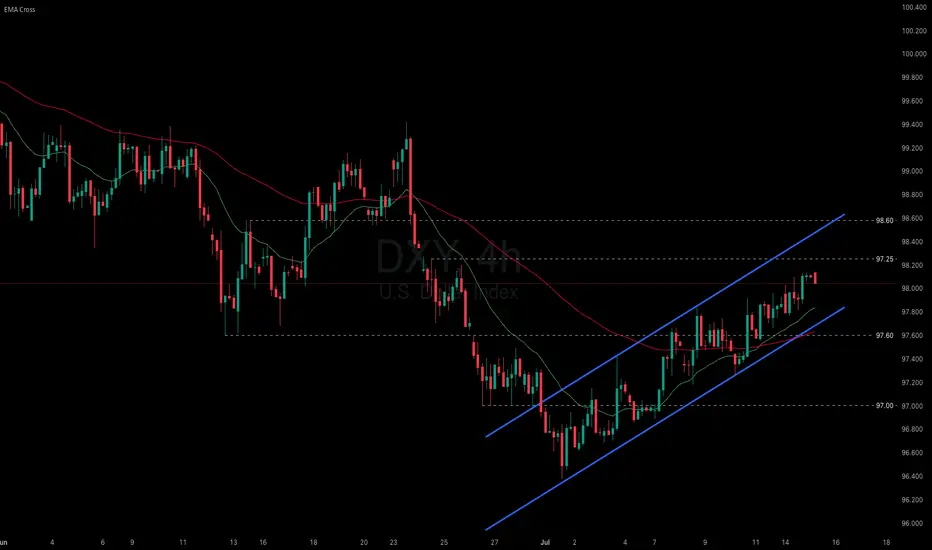
Dollar holds steady uptrend despite Trump’s tariff threats.
President Trump announced a 30% tariff on imports from both the EU and Mexico, a hike from the 20% previously imposed on the EU in April. He also warned that if no agreement is reached on the Ukraine war within 50 days, countries trading with Russia could face a 100% tariff.
Meanwhile, market volatility is being amplified by speculation over Fed Chair Powell’s potential dismissal, as attacks against him intensify from Trump and his allies. Deutsche Bank warned that Powell’s removal could trigger sharp swings in both the dollar and bond markets.
DXY has extended its two-week rally after testing the recent low, approaching the 98.00 threshold. The index remains within the ascending channel, indicating the potential continuation of bullish momentum. If DXY breaches above the resistance at 98.25, the index could gain upward momentum toward 98.60. Conversely, if DXY breaks below the support at 97.60, the index may retreat to 97.00.
DXY Previous weeks analysis and July 13 week ahead ideasDXY
July 13
July 7 to 11 DELIVERY NOTES
I suspected that price would gravitate for higher prices in last Sundays analysis, celebrate on
*up closed candle on the weekly, rebalancing SIBI from June 23 week
*Price retraced to close on equilibrium on the current range
*Monday delivered an expansion
*Tuesday retraced to Monday CE of the daily candle
*Wednesday consolidation
*Thursday retraced to a discount then reversed to take Mondays buy stops
*Friday expansion to make the high of the week closing on the CE of the FVG from Wed June 25
July 14 to 18 Ideas
Bear bias
*Since July 2 Price has been seeking higher prices, further example of trending market
*Price reaching equilibrium on the HTF range and buy side taken last week
*I suspect that price will retrace for sell side liquidity this week
*I anticipate for Price to gravitate towards the EV at 97.430 for the low target this week, possibly the noted equal lows from Monday July 7
*Friday's delivery was a in consolidation pattern
*Sundays delivery could gravitate to the noted equal highs and noted FVG
*I suspect that Price will expand to seek lower Prices for Mondays delivery
*Price expand higher in Sundays delivery, we could see Price retrace Fridays in FVG
No News Monday and Friday

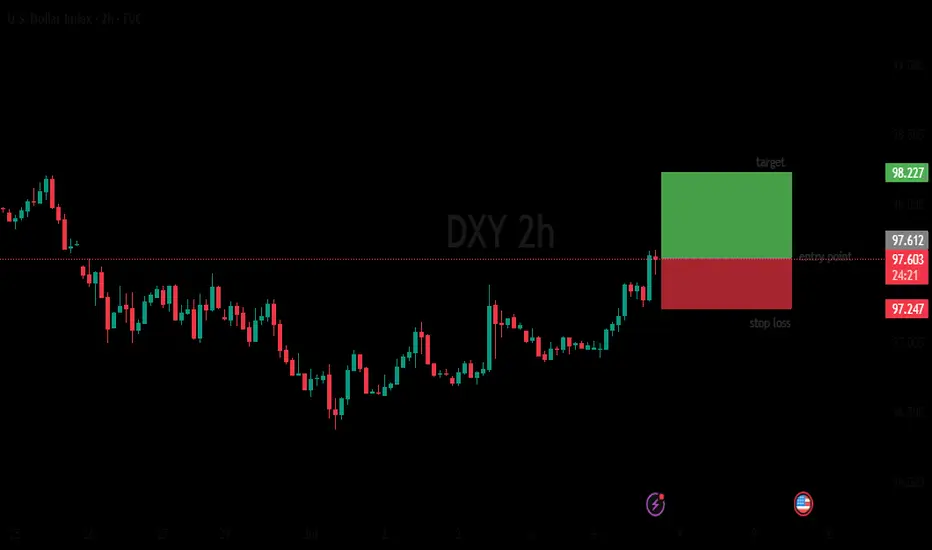
DXY 2HOURS BULISH ANALISISThe image shows a screenshot of a computer screen displaying a graph on a trading platform. The graph is titled "U.S. Dollar Index" and has a dark blue background with red and green bars indicating price movements over time.
Dollar Index Having Bullish MomentumDollar Index shown good bullish momentum on previous day as we analyzed it earlier. Index has created a imbalance now the possibility for the index is to retrace back to imbalance and continue the bullish momentum and target towards the supply zone and swing high.

deepseek→→U.S. Dollar Index (DXY) Recent Analysis and Outlookchina deepseek↓↓
### **U.S. Dollar Index (DXY) Recent Analysis and Outlook**
#### **1. Current Market Trends and Driving Factors**
- **Trade Policies Boost the Dollar**: U.S. President Trump recently announced new tariffs on Canada (35%), the EU, and Mexico (30%), triggering risk-off sentiment and pushing the Dollar Index (DXY) from 97.20 to around 98.00.
- **CPI Data as a Key Variable**: The U.S. June CPI data, released today (July 15), will influence market expectations for Fed rate cuts. Stronger-than-expected inflation could reinforce the dollar's rally, while weak data may weaken it.
- **Shift in Market Sentiment**: Unlike the "dollar sell-off" trend in early 2025, recent market reactions have leaned toward treating the dollar as a "safe-haven asset" rather than selling it solely due to trade war concerns.
#### **2. Technical Analysis**
- **Key Resistance and Support Levels**:
- **Resistance**: 97.80-98.00 (short-term critical range). A breakout could test 98.50 or even 99.00.
- **Support**: 97.50 (50-day moving average). A drop below may target 96.38 (June low).
- **Technical Indicators**:
- **MACD**: A golden cross has formed on the daily chart, but it remains below the zero line, suggesting the current rebound may still be corrective.
- **RSI**: Near the 50 neutral zone, not yet overbought, indicating room for further upside.
#### **3. Short-Term and Long-Term Outlook**
- **Short-Term (1-2 Weeks)**:
- **Bullish Scenario**: If CPI data is strong and DXY breaks above 98.20, it could challenge 98.50-99.00.
- **Bearish Scenario**: Weak CPI data or progress in trade talks may push DXY back to 97.30-96.50.
- **Long-Term (Second Half of 2025)**:
- **Structural Pressures Remain**: Despite the short-term rebound, the dollar still faces long-term challenges, including widening U.S. fiscal deficits, de-dollarization trends, and concerns over Fed independence.
- **Historical Trend**: After falling over 10% in the first half of 2025, DXY may continue its downtrend in the second half, though the pace of decline could slow.
#### **4. Key Risk Factors**
- **Fed Policy**: If CPI data reinforces a "higher-for-longer" rate outlook, the dollar may strengthen further. Conversely, rising rate-cut expectations could weigh on the dollar.
- **Geopolitics and Trade Talks**: Compromises from the EU or Mexico could reduce safe-haven demand, while failed negotiations may fuel further dollar gains due to risk aversion.
### **Conclusion**
The DXY is at a critical juncture, with short-term direction hinging on CPI data and trade policy developments. Technicals lean bullish, but long-term fundamentals remain challenging. Traders should closely monitor the 98.00 breakout and today’s CPI data impact.

Water point of view, the dollar needs a small shock rise after fWater point of view, the dollar needs a small shock rise after falling too much, slow down and continue to fall............
It was pulled up to the upper boundary before, and the decline was smooth and fast. What should I do if the decline is too fast? Slow down
Continue to see the decline, the trillion-dollar debt of the United States is a big pit, depreciation will prolong life
Dollar Index Seems BullishFrom the previous week candle we see that Dollar Index has closed bullish. And in this scenario we can expect Dxy to go further higher. It has hit the previous week high and touched supply zone residing above. The two possibilities have shown in the chart are
1: After touching supply zone we expect to have deeper pullback.
2: It will have short retracement and then continues hgiher.

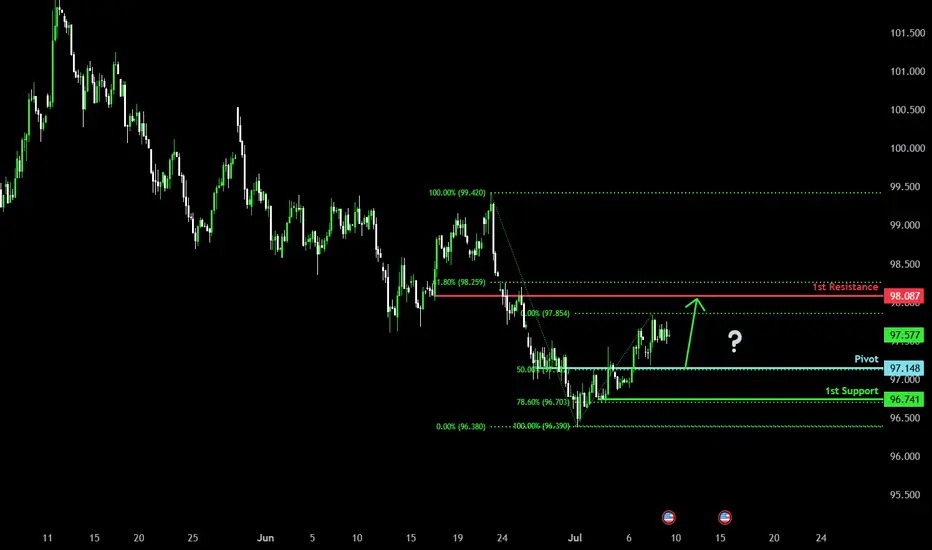
Bullish bounce off major support?US Dollar Index (DXY) is falling towards the pivot which has been identified as an overlap support and could bounce to the 1st resistance.
Pivot: 97.14
1st Support: 96.74
1st Resistance: 98.08
Risk Warning:
Trading Forex and CFDs carries a high level of risk to your capital and you should only trade with money you can afford to lose. Trading Forex and CFDs may not be suitable for all investors, so please ensure that you fully understand the risks involved and seek independent advice if necessary.
Disclaimer:
The above opinions given constitute general market commentary, and do not constitute the opinion or advice of IC Markets or any form of personal or investment advice.
Any opinions, news, research, analyses, prices, other information, or links to third-party sites contained on this website are provided on an "as-is" basis, are intended only to be informative, is not an advice nor a recommendation, nor research, or a record of our trading prices, or an offer of, or solicitation for a transaction in any financial instrument and thus should not be treated as such. The information provided does not involve any specific investment objectives, financial situation and needs of any specific person who may receive it. Please be aware, that past performance is not a reliable indicator of future performance and/or results. Past Performance or Forward-looking scenarios based upon the reasonable beliefs of the third-party provider are not a guarantee of future performance. Actual results may differ materially from those anticipated in forward-looking or past performance statements. IC Markets makes no representation or warranty and assumes no liability as to the accuracy or completeness of the information provided, nor any loss arising from any investment based on a recommendation, forecast or any information supplied by any third-party.
Could the price reverse from here?The US Dollar Index (DXY) is rising towards the pivot, which has been identified as a pullback resistance that aligns with the 50% Fibonacci retracement and could drop to the 1st support.
Pivot: 97.90
1st Support: 96.74
1st Resistance: 98.67
Risk Warning:
Trading Forex and CFDs carries a high level of risk to your capital and you should only trade with money you can afford to lose. Trading Forex and CFDs may not be suitable for all investors, so please ensure that you fully understand the risks involved and seek independent advice if necessary.
Disclaimer:
The above opinions given constitute general market commentary, and do not constitute the opinion or advice of IC Markets or any form of personal or investment advice.
Any opinions, news, research, analyses, prices, other information, or links to third-party sites contained on this website are provided on an "as-is" basis, are intended only to be informative, is not an advice nor a recommendation, nor research, or a record of our trading prices, or an offer of, or solicitation for a transaction in any financial instrument and thus should not be treated as such. The information provided does not involve any specific investment objectives, financial situation and needs of any specific person who may receive it. Please be aware, that past performance is not a reliable indicator of future performance and/or results. Past Performance or Forward-looking scenarios based upon the reasonable beliefs of the third-party provider are not a guarantee of future performance. Actual results may differ materially from those anticipated in forward-looking or past performance statements. IC Markets makes no representation or warranty and assumes no liability as to the accuracy or completeness of the information provided, nor any loss arising from any investment based on a recommendation, forecast or any information supplied by any third-party.

DXY Targeting Liquidity Zones & Gap Fill Before Potential ReversThe U.S. Dollar Index (DXY) is showing a strong bullish push, climbing steadily along an ascending trendline. Price appears to be heading toward key liquidity levels and a visible Fair Value Gap (FVG) near the previous New York high. The chart also highlights an unfilled gap above, which aligns with a potential liquidity sweep scenario.
Once these upper zones are tapped — including the liquidity and imbalance areas — a significant rejection could follow, especially considering ongoing strength in the Euro (EUR). This setup suggests a high-probability reversal opportunity after the liquidity grab

DXY Jul. 11The information and publications are not meant to be, and do not constitute, financial, investment, trading, or other types of advice or recommendations.
Have a nice day ahead.

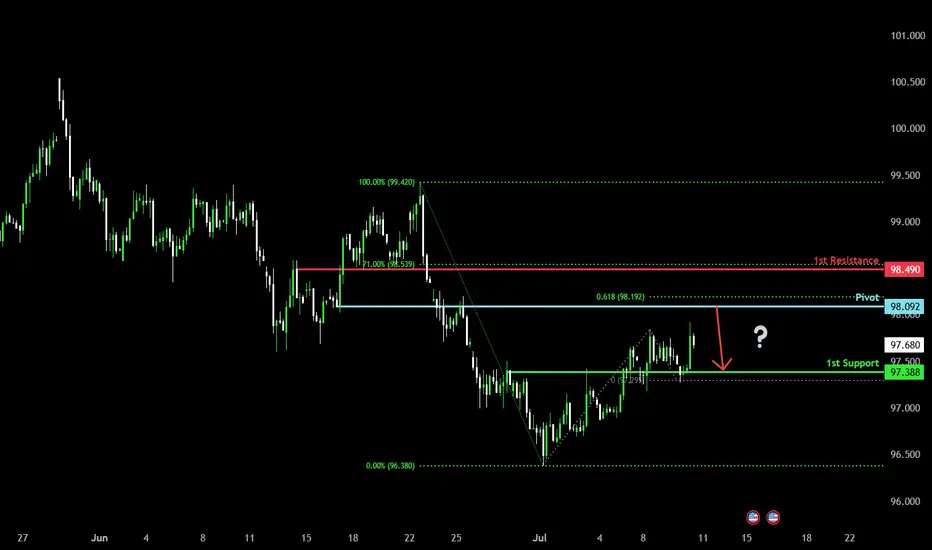
Could the price reverse from here?US Dollar Index (DXY) is rising towards the pivot and could reverse to the 1st support which acts as an overlap support.
Pivot: 98.09
1st Support: 97.38
1st Resistance: 98.49
Risk Warning:
Trading Forex and CFDs carries a high level of risk to your capital and you should only trade with money you can afford to lose. Trading Forex and CFDs may not be suitable for all investors, so please ensure that you fully understand the risks involved and seek independent advice if necessary.
Disclaimer:
The above opinions given constitute general market commentary, and do not constitute the opinion or advice of IC Markets or any form of personal or investment advice.
Any opinions, news, research, analyses, prices, other information, or links to third-party sites contained on this website are provided on an "as-is" basis, are intended only to be informative, is not an advice nor a recommendation, nor research, or a record of our trading prices, or an offer of, or solicitation for a transaction in any financial instrument and thus should not be treated as such. The information provided does not involve any specific investment objectives, financial situation and needs of any specific person who may receive it. Please be aware, that past performance is not a reliable indicator of future performance and/or results. Past Performance or Forward-looking scenarios based upon the reasonable beliefs of the third-party provider are not a guarantee of future performance. Actual results may differ materially from those anticipated in forward-looking or past performance statements. IC Markets makes no representation or warranty and assumes no liability as to the accuracy or completeness of the information provided, nor any loss arising from any investment based on a recommendation, forecast or any information supplied by any third-party.
Dollar Index Analysis [DXY]Market has show upper wicks for last 3 days which is the sign that there is still sell pressure. The daily candles for this week are range bound. 4H chart is showing short term uptrend which is maintaining higher highs and higher lows. We can use this range to have scalps in this range.

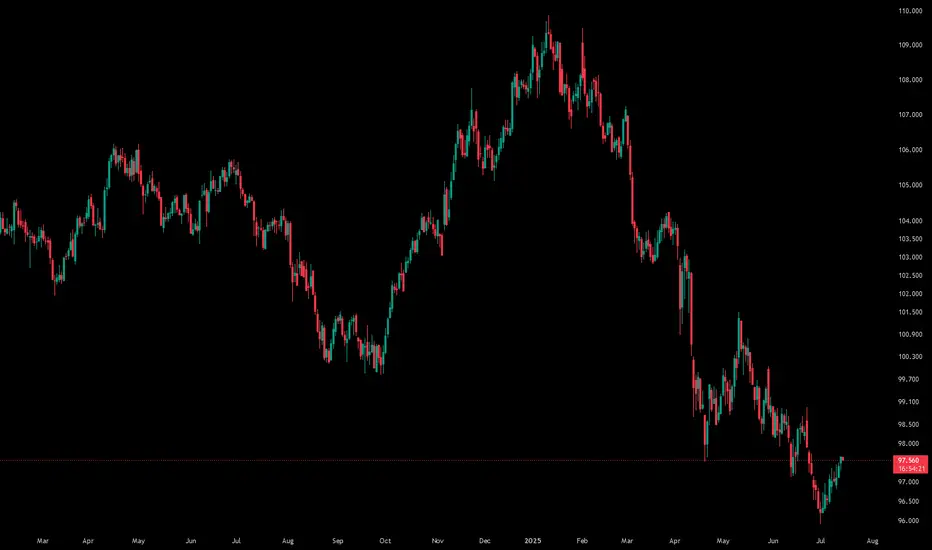
DXY - MonthlyEvery breakdown in the past the DXY had a steep decline. Not really a period where it has continued to fluctuate at a certain level. I think it might be plausible that this pattern will continue to repeat itself.

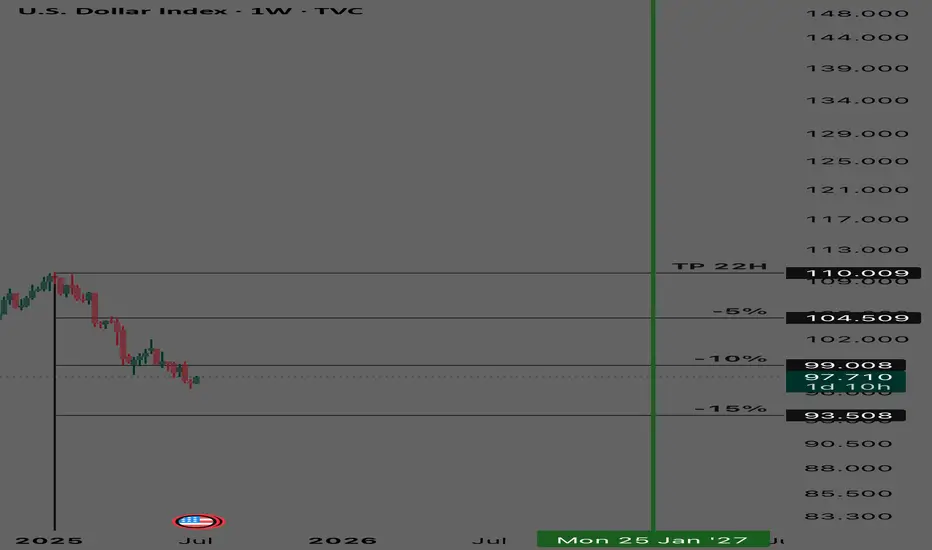
DXY - Long Term Buy Cycle DXY
Long term buy cycle
Started January 2025
TP 110
% Bubble Ratio
Currently in a negative bubble with a fair value at 110