DXY July 6 AnalysisDXY
July 6
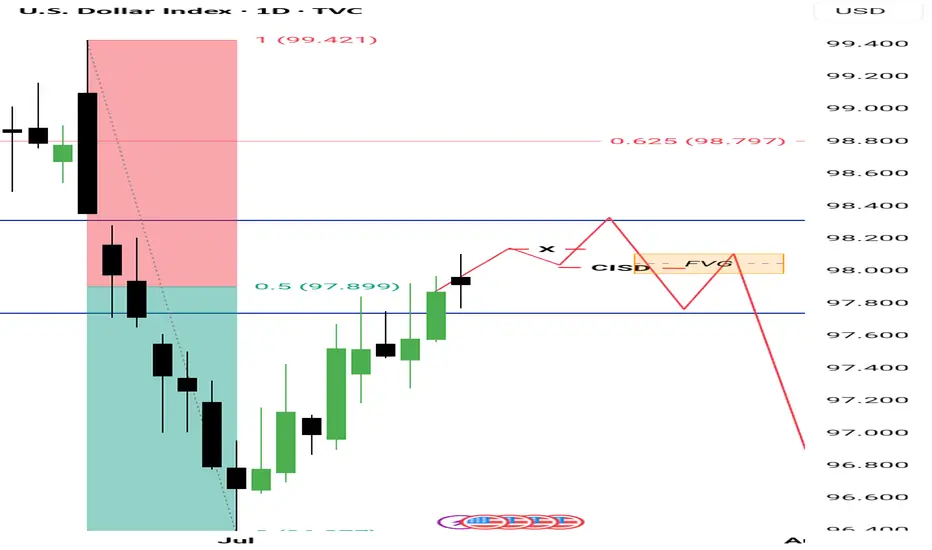
Parent Bias Bear
WEEKLY ANALYSIS
*Good example to witness price trend for the second week-the pull back I was anticipating did occur just not to the level I had suggested in last Sundays journal
*Note Price wicked to the .70 level on the monthly
*Price took key equal lows and rebalanced a FVG from Feb 22
*Monday/Tuesday Price seek lower prices
*Mid week consolidation-expected
*Thursday price took equal highs I was anticipating
*Friday Asia
*PM session of NY price retraced to close in consolidation
*Thursday expansion to buy side then on Friday reversal
WEEK AHEAD IDEAS
*Price closes in a consolidation on the previous days range 50%
*I suspect that price could seek the minor equal highs/FVG potentially reach for the gap from Thursday possible target should it really expand - this could be Sundays delivery
*could price expand for higher prices beginning of the week
*No news until Wednesday
*Sundays delivery can affect my ideas stay open
USXUSD trade ideas

DXY Potential Bullish Reversal – Target 99.456 DXY Potential Bullish Reversal – Target 99.456 🎯
Technical Analysis Overview:
🔹 Trend Structure:
The chart illustrates a recent downtrend, which has been broken as price moved above the descending trendline, signaling a potential trend reversal.
🔹 Pattern Insight:
A bullish harmonic pattern is visible (possibly a bullish Bat or Gartley), with the price reacting from the PRZ (Potential Reversal Zone), aligning with key support near 96.500. The market has respected this zone multiple times, evident from the orange highlighted circles showing price rejections.
🔹 Support & Resistance:
Support Zone: ~96.500
Breakout Zone: ~96.985 (current consolidation near this resistance)
Target Zone: Marked at 99.456, which aligns with previous structure and fib projection.
🔹 Market Sentiment:
Price is consolidating after breaking the downtrend, forming a bullish rectangle (accumulation). The green arrows indicate bullish intent from buyers defending support levels.
🔹 Price Action Signal:
Formation of higher lows.
Break of structure and close above previous highs.
Possible breakout pending above consolidation box.
📊 Conclusion:
DXY shows bullish potential as it builds a base around strong support. A confirmed breakout above the rectangle could fuel a rally toward 99.456. Keep an eye on volume and confirmation candles for entry. ✅

FX Matrix: DXY, EUR/USD, GBP/USD Weekly AnalysisWeekly Targets: (Gun to my head)
DXY: 99.957, 100.424, 100.689
GBPUSD: 1.31643, 1.31453,

DXY Indecisive
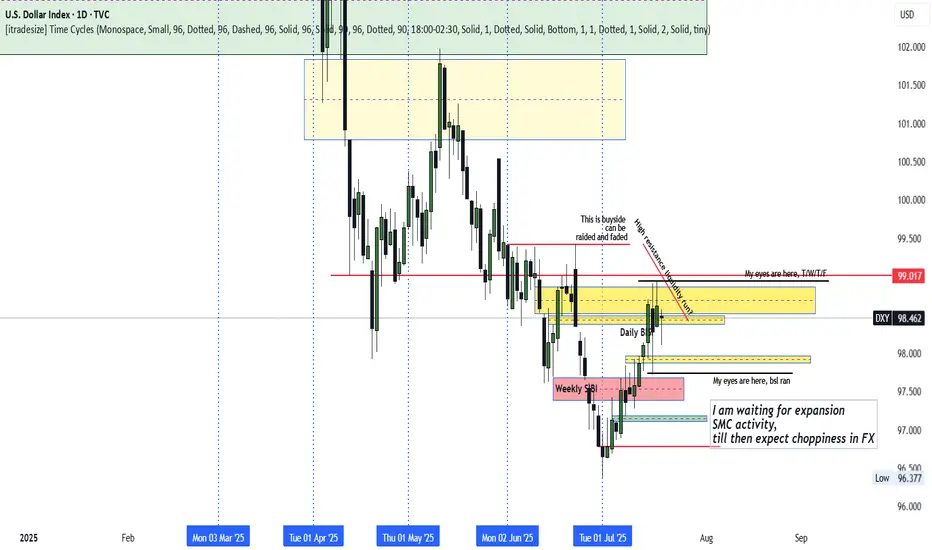
DXY remains locked in its previous week's range, especially locked in Wednesday's range.
The Thursday rally above Wednesday's high appears to be a fake breakout aimed at trapping traders long.
With stops seemingly below Wednesday (Previous Week Low), how we trade past the previous week high or/and low should inform the unfolding direction.
With a run to the previous week's low and high possible, caution is recommended. Await expansion avoid the surge of new's release in the coming week and the choppiness that could unfold.
DXYDXY refers to the U.S dollar index ,an index that measures the value of united state dollar relative to a basket of six major foreign currencies ,it was originally developed by FED'S
THE SIX MEJOR CURRENCIES ARE ;
.euro,japaneses yen, pounds sterling, Canadian dollar, Swedish krona,swiss franc.
the index is used by investors ,traders and economist to gauge the overall strength of the U.S dollar in a global currency markets. Its rise and fall will influence trade ,investment and monetary policy decision in fx window.
on 4hr we are rejected and i will watch market open and close on Monday for trade directional bias for the following pairs (AUDUSD,USDCAD,USDZAR,GBPUSD,EURUSD,USDJPY,XAUUSD XAGUSD,XCUUSD,BITCOIN )
NOTE;TRADING IS 100% PROBABILITY,RISK MANAGEMENT IS KEY AND GET ACCOUNTABLITY PARTENER WHO WILL BE CHECKING YOUR WORK..
#DXY #DOLLAR

DXY area to watch.Approaching the extreme of the recent bearish leg. If it holds, then expect most major pairs (EURUSD, GBPUSD etc) to continue their upside momentum. If it fails, then we can expect to see further downside moves on the majors.
As per my strategy. That extreme POI swept a previous high, created the BOS, and sits beautifully on the 71% retracement level. The majority of my confluences are ticked, just missing that clear 'Imbalance'. So now we wait, and monitor the reaction on the 4H. If we see a nice clean liquidity sweep, BOS + Imbalance then I'm in for sells.
Let me know your thoughts, anything can happen!

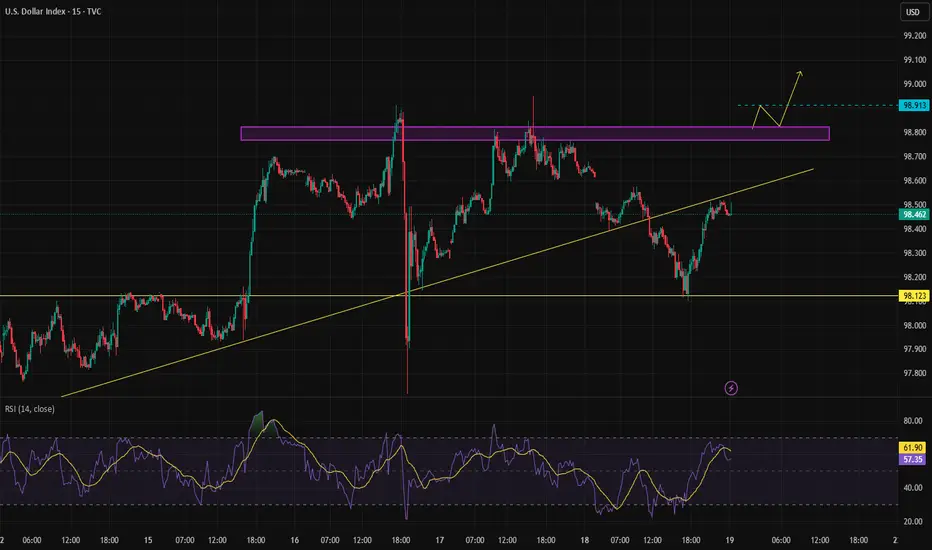
DXY – Short-Term OutlookThis week, we’ll be analyzing several currency pairs that are showing promising trading setups.
Unlike previous weeks, we plan to focus on lower timeframes and shorter market cycles to take advantage of more agile trading opportunities.
If the price manages to give us a clear confirmation within the marked zone, we can start considering a potential shift to a bullish trend on DXY.
This would set the stage for preparing long positions, as market structure would likely begin aligning in favor of the bulls.
Until that confirmation arrives, we stay cautious and wait for price action to validate the move.
Dollar Index Macro analysisCurrently the Fed's Dollar is kept at 5.50% which is higher than any other currency except for the Kiwi , As we all know interest have high impact on currency prices. We are currently in a consolidation market profile. Therefore my interest is where the next expansion will be at, Clearly defined on my analysis it should be on the upside.

EURUSD heading for a bearish dropThere is a valid supply zone having a financial move that broke structure. looking properly at the left hand side of the supply zone there is no structural liquidity, so the supply zone is expected to fail before the sells, or create some form of liquidity around the supply zone.
Kindly follow Structure, POI, liquidity and can scale down to m5 for sniper entry and apply proper risk management.

### **Bearish Analysis of DXY (U.S. Dollar Index)**### **Bearish Analysis of DXY (U.S. Dollar Index)**
The U.S. Dollar Index (DXY) has recently shown a weak trend, with a prevailing bearish sentiment in the market. The primary factors driving this outlook include:
### **1. Rising Expectations of Fed Rate Cuts**
- Recent weak U.S. inflation data (such as May's PPI and CPI) have reinforced market expectations that the Fed may cut rates as early as September.
- Morgan Stanley predicts the Fed could implement a cumulative 175 basis points in rate cuts by 2025, further reducing the dollar's appeal.
### **2. Trade Policy Uncertainty**
- The Trump administration has recently threatened new tariffs (e.g., 30% on imports) against the EU, Mexico, and other nations, escalating global trade tensions.
- Wall Street institutions warn that Trump’s tariff policies could trigger capital outflows, putting additional pressure on the dollar.
### **3. Growing Recession Concerns**
- Fears of a U.S. economic "hard landing" are intensifying, particularly due to deteriorating corporate orders, earnings forecasts, and capital expenditure plans, which could weaken the dollar’s safe-haven status.
- The expanding U.S. fiscal deficit (reaching $1.36 trillion this fiscal year) is further eroding confidence in the dollar.
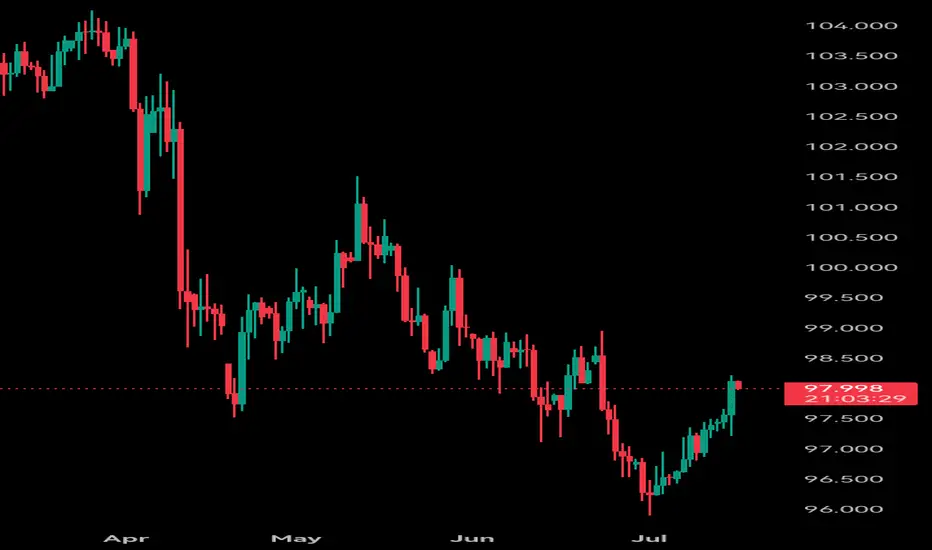
### **4. Technical Weakness**
- Since the beginning of 2025, DXY has fallen by approximately **8.4%**, marking its worst annual start on record.
- The index currently faces key resistance at the **97.80-98.00** range. A failure to break above this level could lead to further declines toward **96.50** or lower.
- RSI and MACD indicators suggest weak short-term rebound momentum, maintaining a bearish bias.
### **5. Risk of Capital Outflows**
- The U.S. "**899 Asset Tax**" proposal could increase costs for foreign investors holding dollar-denominated assets, potentially accelerating global divestment from the dollar.
- Goldman Sachs estimates that the dollar remains **overvalued by ~15%**, leaving room for further depreciation.
### **Outlook**
In the near term, DXY’s movement will depend on:
- **June CPI Data** (A lower-than-expected reading could reinforce rate cut expectations, further weakening the dollar).
- **Trade Negotiation Developments** (Escalating tensions may trigger risk-off sentiment, while easing could relieve dollar pressure).
- **Fed Policy Signals** (More explicit dovish guidance could extend the dollar’s downtrend).
**Conclusion:** Given multiple bearish factors, the U.S. Dollar Index is likely to remain weak in the short term. Traders should closely monitor key economic data and policy shifts.
DXY Weekly Update — July 14, 2025⌛ Timeframe:
.
📆 Analysis Date: July 14, 2025
.
🎯 Weekly Bias: Bearish-to-Neutral (Potential for retracement or reversal)
🔎 Market Overview:
⬇️ Persistent USD Weakness:
DXY has dropped nearly 10% YTD, marking the steepest half-year decline since 1986.
📉 Rate Cut Expectations:
Markets are pricing in a potential 75bps rate cut by the Fed in H2 2025, pushing yields and the dollar lower.
📦 Trade War Fears:
Renewed tariff risks (targeting EU, Japan, Mexico, South Korea) aren't boosting demand for USD — a signal of lost safe-haven appeal.
⚖️ Central Bank Diversification:
Global reserve managers are rotating into gold and away from USD, weakening long-term structural demand.
🌀 Sentiment & Risk Appetite:
💸 Liquidity Demand is Soft:
DXY is retesting a 4H fair value gap (97.10–97.30), suggesting potential short-term consolidation or correction.
🌍 Risk-On Mood Returns:
According to Goldman Sachs, the USD is trading more like a "risk asset" than a haven, aligning with rising equity appetite.
📉 Technical Landscape:
🟠 4H Structure:
If DXY breaks below 97.00, next support lies at 96.37, followed by 95.50–96.00.
Consolidation expected if price remains within the FVG.
🔻 Key Resistance:
97.70–98.20 zone. A break above this area could change the tone to bullish.
📌 Summary:
🔷 Fundamentals show long-term dollar weakening (rates, trade tension, reserve shifts)
🔷 Sentiment aligns with risk-on appetite and reduced USD demand
🔷 Technicals at critical level; break below 97.00 opens room for correction, break above 97.70 shifts bias bullish
.
.
.
.
🟠 Bias: Bearish to Neutral
Watch Levels: 97.00 support, 97.70–98.20 resistance
⚠️ Note: This analysis is for educational purposes only and is not financial advice. Always apply risk management.
✅ If you like this analysis, don't forget to like 👍, follow 🧠, and share your thoughts below 💬!

POSSIBLE PLAY FOR THE WEEKHTF KEY LEVEL
1. Premium gap/volume imbalance (DAILY TF)
2. monthly inverted fvg premium marked in Blue lines
I'd be watching the hourly time frame to get a setup as marked in red to engage for the week.
NOTE: CPI Tuesday
DXY: The Market Is Looking Down! Short!
My dear friends,
Today we will analyse DXY together☺️
The in-trend continuation seems likely as the current long-term trend appears to be strong, and price is holding above a key level of 97.370 So a bullish continuation seems plausible, targeting the next high. We should enter on confirmation, and place a stop-loss beyond the recent swing level.
❤️Sending you lots of Love and Hugs❤️

DXY Bearish Bias
Institutions are currently holding a net short position on the Dollar, indicating bearish sentiment. With a net position of -4,282, we may expect continued weakness in the DXY, especially if price reacts from key supply zones. Swing traders should remain cautious with long setups and prioritize opportunities aligned with USD weakness across major pairs.

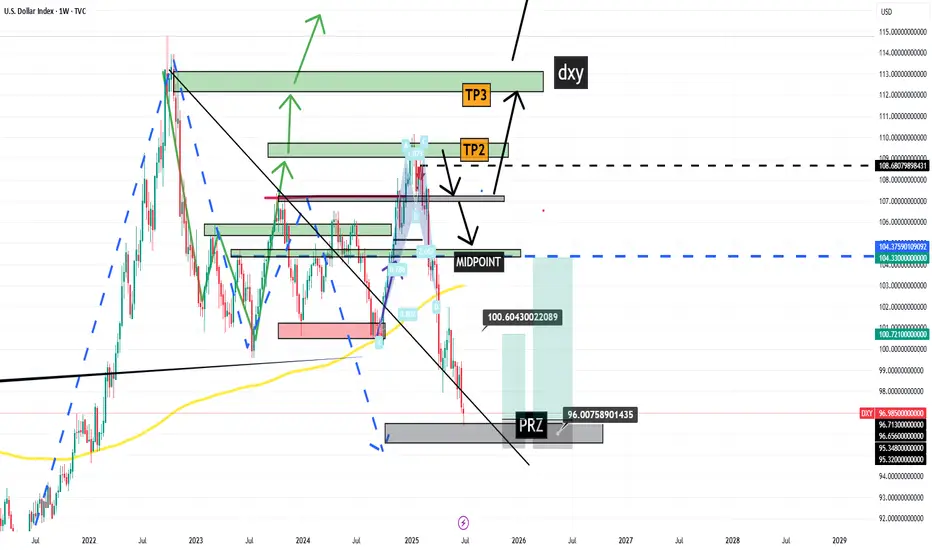
Bold analysis for the most powerful currency in the world (DXY)Orange range: entering in several steps .
Green area: important support and exit point .
Important note: The gray line is the liquidity range
Watch the dance around this line carefully (bank positions are settled around this line)
And in my opinion, by increasing the price, they are emptying it on the buyers, so buy cautiously, but sell boldly.
GL

DXYInstitutions are currently holding a net short position on the Dollar, indicating bearish sentiment. With a net position of -4,282, we may expect continued weakness in the DXY, especially if price reacts from key supply zones. Swing traders should remain cautious with long setups and prioritize opportunities aligned with USD weakness across major pairs.

DXY Bearish Setup
Entry: 97.50 (current price)
Target (TP): 96.500 or below
Stop Loss (SL): ~97.80 (above recent swing high or resistance)
Risk Management: Essential — position size based on SL distance and account size
🔍 Trade Rationale:
Technical View: Price may be forming a lower high, suggesting possible downside continuation.
Fundamental Pressure:
Market cautious on Fed rate path
Tariff uncertainty could weaken USD
Upcoming FOMC minutes may add pressure if dovish signals emerge

DXY LOCAL SHORT|
✅DXY is about to retest a key structure level of 98.000
Which implies a high likelihood of a move down
As some market participants will be taking profit from long positions
While others will find this price level to be good for selling
So as usual we will have a chance to ride the wave of a bearish correction
SHORT🔥
✅Like and subscribe to never miss a new idea!✅
Disclosure: I am part of Trade Nation's Influencer program and receive a monthly fee for using their TradingView charts in my analysis.

DXY shortPrice had broken our support level and hence i expect i continuous downward movement in price, although price cloud retest the support level that was turn into a resistance level before continuing it bearish move.

DXY: Bears Are Winning! Short!
My dear friends,
Today we will analyse DXY together☺️
The recent price action suggests a shift in mid-term momentum. A break below the current local range around 96.860 will confirm the new direction downwards with the target being the next key level of 96.760.and a reconvened placement of a stop-loss beyond the range.
❤️Sending you lots of Love and Hugs❤️

Check the trend It is expected that a trend change will form at the current resistance level and a continuation of the downtrend will form. Otherwise, the continuation of the uptrend to the specified resistance levels will be possible and then there will be a possibility of a trend change at the specified resistance levels.

3 key reasons why the U.S. dollar is losing value📉 According to J.P. Morgan, here are 3 key reasons why the U.S. dollar is losing value:
1️⃣ Oil and energy deals are now being done in other currencies
2️⃣ U.S. banks are excluded from new global payment systems
3️⃣ Countries are reducing their USD reserves
The world is slowly shifting away from dollar dependence...
#USD #DollarDecline #JPMorgan #ForexNews #DeDollarization #OilTrade #CurrencyShift #GlobalEconomy #SmartMoney #FXForever #MarketUpdate #ForexTraders #USDBreakdown #EconomicTrends #GlobalFinance
