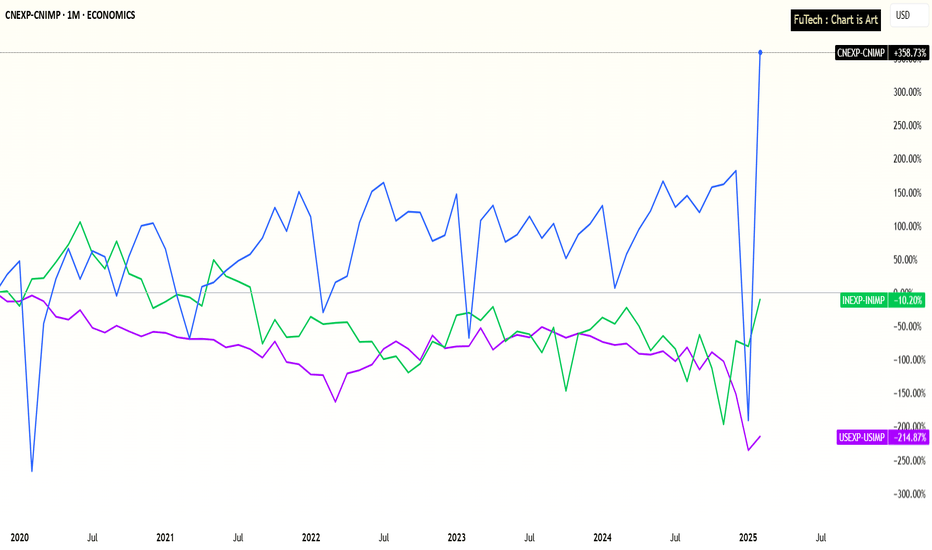
India, USA, China - Trade Deficit Performance after Covid PhaseIndia’s Trade Deficit Nearing a Turning Point – Strong Growth Amid Global Shifts
Trade Deficit Performance Over the Last 5 Years:
India: -10%
USA: -215%
China: +359%
Over the past five years, global trade dynamics have shifted significantly, with India showing promising signs of a turnaround in its trade performance.
India: A Rounding Bottom Pattern?
India’s trade deficit has improved by -10% over the last five years, hinting at a potential rounding bottom pattern that could transition into a trade surplus in the coming years.
This positive shift comes despite global economic headwinds, positioning India as a resilient and emerging export player.
USA: Longer Road to Recovery
In contrast, the United States has seen its trade deficit worsen by -215%, suggesting a deeper structural challenge in its trade balance.
While the U.S. economy remains strong in other metrics, its export-import imbalance will likely take more time and policy adjustments to stabilize.
China: The Export Powerhouse slowdown after Tariffs sanctions ?
China continues to dominate with a staggering +359% improvement in its trade surplus over the past five years, solidifying its position as the world’s top exporter.
However, rising global tariffs and geopolitical tensions could gradually redirect supply chains.
🌏 Macro Implications:
Tariff Realignment: As global companies look to diversify away from China amid escalating tariffs and political tensions, India is emerging as a key beneficiary.
This realignment could significantly bolster India’s export sector.
India’s Growth Story: With structural reforms, expanding manufacturing capabilities, and supportive government policies like PLI (Production-Linked Incentives), India is well-positioned to capture a larger share of global trade flows.
Global Slowdown, Local Resilience: Despite a global economic slowdown, India’s improving trade dynamics signal strong internal momentum and a maturing economy.
📈 Conclusion:
India is on the cusp of a major trade shift.
While China remains the global leader in exports and the USA faces growing imbalances, India’s improving trade performance, geopolitical advantage, and manufacturing push make it a compelling long-term trade and investment story.
Amid Tariffs war and global economy slowdown, India's growth story continues...
CNEXP trade ideas
75: China Export Analysis - Fundamental and Technical OverviewThe European Union (EU) and the United States have increased scrutiny and imposed higher tariffs on Chinese imports, particularly electric vehicles and strategic materials like gallium and germanium. These measures are designed to protect domestic industries from what are perceived as unfair trade practices and subsidies by the Chinese government.
Additionally, the EU's new Critical Raw Material Act and battery regulations aim to reduce dependency on Chinese imports and secure supply chains for critical technologies. These regulatory changes have led to a noticeable decline in Chinese exports to the EU.
In response, China has imposed export restrictions on key materials, further straining trade relations. These geopolitical tensions and trade barriers have significantly impacted China's export figures.
Currently, China's export trend is showing a downward trajectory. The export figures have struggled to reach the $350 billion mark and are at risk of dropping significantly lower, potentially towards the $140 billion level.
Chart Overview:
Trend Line: A clear downtrend is visible on the chart, with lower highs and lower lows indicating sustained pressure.
Support and Resistance Levels:
Resistance: The $350 billion level is the upcoming resistance. That has not yet been reached.
Support: Immediate support is observed around $250 billion. A break below this level could accelerate the downward move towards $140 billion.
Will We Reach $350 Billion or Go Lower?
Given the current economic and geopolitical landscape, it seems still likely that China will reach the $350 billion export mark in the near term because there has not been a really corrective wave in the chart. But the downward pressure from increased tariffs, export restrictions, and the EU's push for supply chain independence are significant hurdles. If these conditions persist, a further decline is a plausible scenario.

