Month on Month US Inflation Harmonically Set to Rise to 1.94%This is a followup to this year-on-year inflation chart idea posted back in June 2022:
The YoY US Inflation rate has been on a trend of going down since it tested the 1.414 PCZ of the Bearish Butterfly above, but recently we have seen the MoM rate slow its descent and form a bottoming pattern with MACD Hidden Bullish Divergence at the 200-Month SMA and now we can see that the MACD has crossed positively as the inflation rate has broken out of its recent range. This harmonically puts it into position where we will likely see it at least hit the 0.886 retrace to complete a small bat pattern, but it could go out of control and go as high as the 1.618 Fibonacci Extension area all the way at about 1.94%.
One reason I suspect for the sudden stop of the inflationary decline is due to the Fed not raising rates high enough, fast enough, and then keeping them the same for the last few months. It would also seem that the year-on-year inflation rate is setting up for a similar rise, showing Hidden Bullish Divergence at the Moving Averages and likely one that will result in it going to test higher highs to around its 1.414-1.618 PCZ once area once more before ultimately crashing back down from these highs once the Fed starts to go heavy on rate hikes again. Though the timeframe may be shorter than how it is presented on the chart, I do still suspect we will have action resembling what is projected on the chart below until the Fed starts rising rates aggressively again:
This does not mean I think stocks will go up, that the dominance of the dollar will go down, or even that I think the consumer credit situation will improve. Instead, I think the rise in inflation will be fueled by energy, import, and export costs, and that this will be very bad for: Stocks, Consumers, REITs, and Banks overall, and that the Bond Yields will continue to rise at an accelerated rate.
USIRMM trade ideas

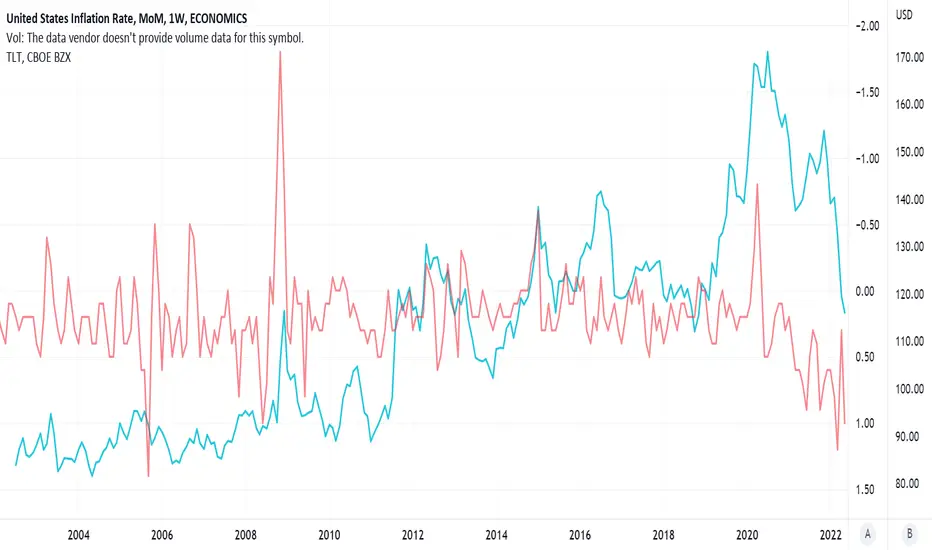
Inverted TLT compared to month-over-month inflation rate in U.S.Pretty clear that TLT trades opposite inflation.
The governments and central banks of the world are all trying to kill inflation.
Inflation Will Recede If Oil Price Drops Chart to illustrate the oil prices as a leading indicator of month over month inflation rates.
Inflation statistics mirror oil price action with a lag of about 1-2 months.
"Federal Reserve Chair Jerome Powell said in his semiannual testimony before the U.S. Senate Banking Committee in March 2022 that, as a rule of thumb, every $10 per barrel increase in the price of crude oil raises inflation by 0.2% and sets back economic growth 0.1%."
If he's right, which he appears to be, we should see inflation month over month drop by .2% when we get the stats on May 11th. That would take us down to 8.3%.
Headed in the right direction, but not fast enough.
Depending on what the Fed does this week and if oil prices have peaked and are rolling over, we might see more of a reprieve from inflation starting in June.
If it isn't enough, the Fed will have to raise rates by at least 50 basis points again.
This may be why Powell is suggesting there will be two 50 basis point jumps in May and June as "frontloading" the hikes and will slow down after.
That's probably the case because high inflation is about to whipsaw into a big recession (as is common after oil peaks and rolls over, historically speaking).

1973-75 Recession vs Fed Funds Rate and Inflation The market didn't bottom until 91 days AFTER the Fed reversed course and Inflation didn't revert to normal until much later.
