$USIRYY -U.S Inflation Rate Seen Rising for 2nd Month (June/2025ECONOMICS:USIRYY
June/2025
source: U.S. Bureau of Labor Statistics
- The annual inflation rate in the US likely accelerated for the second consecutive month to 2.7% in June, the highest level since February, up from 2.4% in May.
On a monthly basis, the CPI is expected to rise by 0.3%, marking th
Key data points
Last release
—
Observation period
Jun 2025
Next release
—
Forecast
—
Highest
23.70 % on Jun 30, 1920
Lowest
−15.80 % on Jun 30, 1921
About US inflation rate YoY
In the United States, unadjusted Consumer Price Index for All Urban Consumers is based on the prices of a market basket of: Food (14% of total weight); Energy (8%); Commodities Less Food & Energy Commodities (21%) and Services Less Energy Services (57%). The last category is divided by: Shelter (32%), Medical Care Services (7%) and Transportation Services (6%).
Related indicators
Weekly Macro Brief: Chinese Economic Data, US Inflation, Tariff CME_MINI:ES1! CME_MINI:NQ1! COMEX:GC1! CME:BTC1! CME_MINI:RTY1! COMEX:SI1! CME_MINI:MNQ1! NYMEX:CL1! CME_MINI:M6E1! CBOT:ZN1! CME_MINI:MES1!
Highlights this week include Chinese economic data points, UK CPI, US CPI, PPI, and Retail Sales. Inflation data is key, as it comes ahe
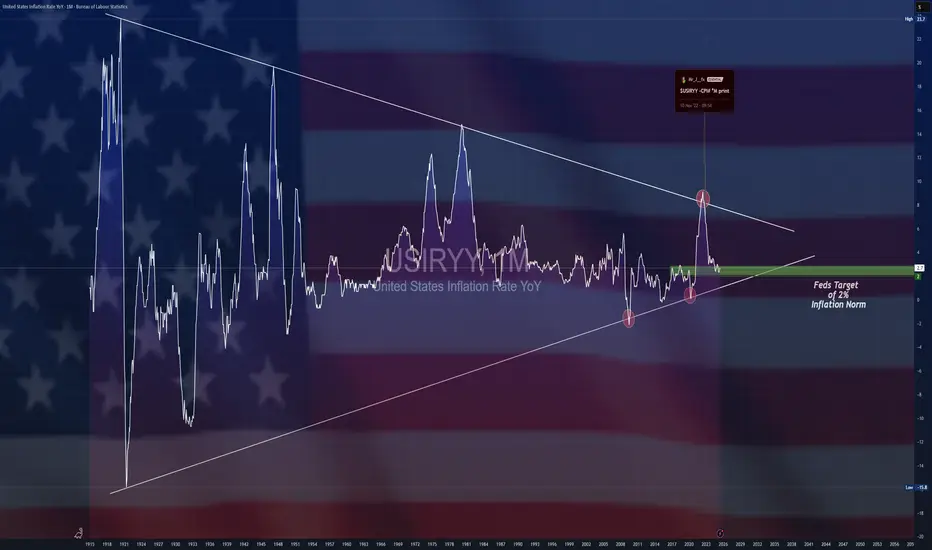
What is Inflation Climate and Weather? Copper is NextThe key driver of most markets — and a major influence on their trends — is inflation.
Once we understand the difference between short-term inflation weather and long-term inflation climate, we can better recognize where risk meets opportunity.
On this half yearly chart. We can see as the close on

$USIRYY -U.S CPI Below Expectations (May/2025)ECONOMICS:USIRYY 2.4%
(May/2025)
source: U.S. Bureau of Labor Statistics
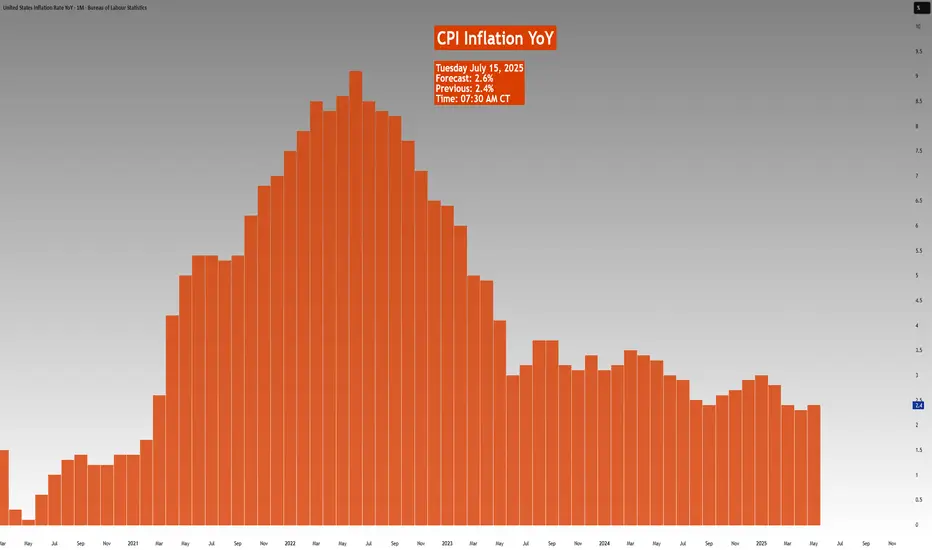
- The annual inflation rate in the US increased for the first time in four months to 2.4% in May from 2.3% in April, though it came in below the expected 2.5%.
Prices rose slightly more for food, used cars and new vehicles

Mid-Week Outlook Update: US CPI- Trade TalksCPI day today. Scheduled to be released at 7:30 AM CT.
CME:6E1! CME_MINI:ES1! CME_MINI:NQ1! CME_MINI:MNQ1! CME_MINI:MES1! COMEX:GC1! CBOT:ZN1!
ES futures edged slightly higher after positive commentary from US-China trade talks. The delegations from both sides agreed on a framework

US INFLATION, a decisive figure this week!This week, which runs from Monday June 9 to Friday June 13, sees two fundamental factors which will have a strong impact on the stock market: the continuation of the trade diplomacy phase which is currently acting as a fundamental red thread (particularly between China and the United States) and, ab

$USIRYY - U.S Inflation Rate Unexpectedly Slows (April/2025)ECONOMICS:USIRYY
April/2025
source: U.S. Bureau of Labor Statistics
- The annual inflation rate in the US eased to 2.3% in April, the lowest since February 2021, from 2.4% in March and below forecasts of 2.4%.
Prices of gasoline fell at a faster pace and inflation also slowed for food and transp

For the last 5 times out of 6.For the last 5 times out of 6.
Gold bottomed when the inflation rate lost a rising support line.

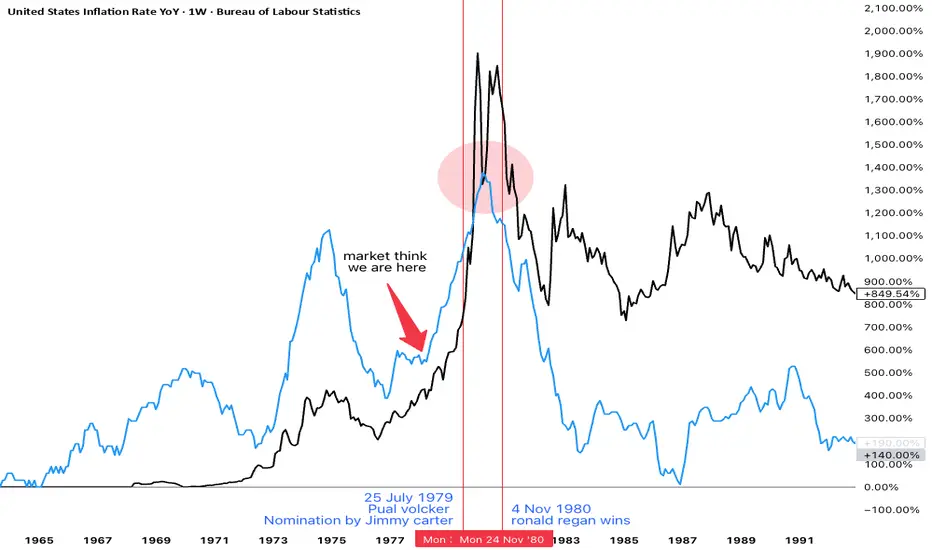
gold and inflation in 1970s stagflation fomc member repeatedly saying this is not stagflation like 1970s
but gold bug on social media constantly pump stagflation narrative after gold historic run from $2000 to $3000 in just one year
with usa cpi and gold chart in one image you can get idea
how gold moved in last stagflation crisis wit
'Inflation is transitory' by FEDFED did that. And it was not elaborate lie. They made money on it. What is next ?

See all ideas
Frequently Asked Questions
The highest figure US inflation rate YoY has ever reached is 23.70%.
The lowest ever US inflation rate YoY is −15.80%.
Last month US inflation rate YoY was 2.70%, and the month before it reached 2.40%. To better understand the dynamics, compare these two values.