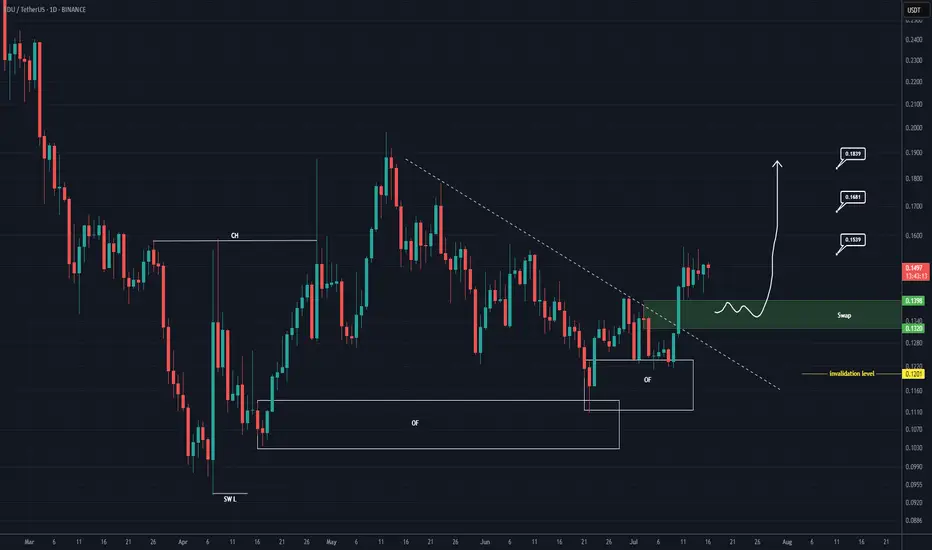
EDU Buy/Long Setup (1D)After forming a swing low, the price has created a bullish Change of Character (CH), and it has flowed well from the origin order blocks.
The trigger line has been broken, and the price has formed a SWAP zone.
Given the bullish signs on the chart, we can consider entering a buy position within the
Related pairs
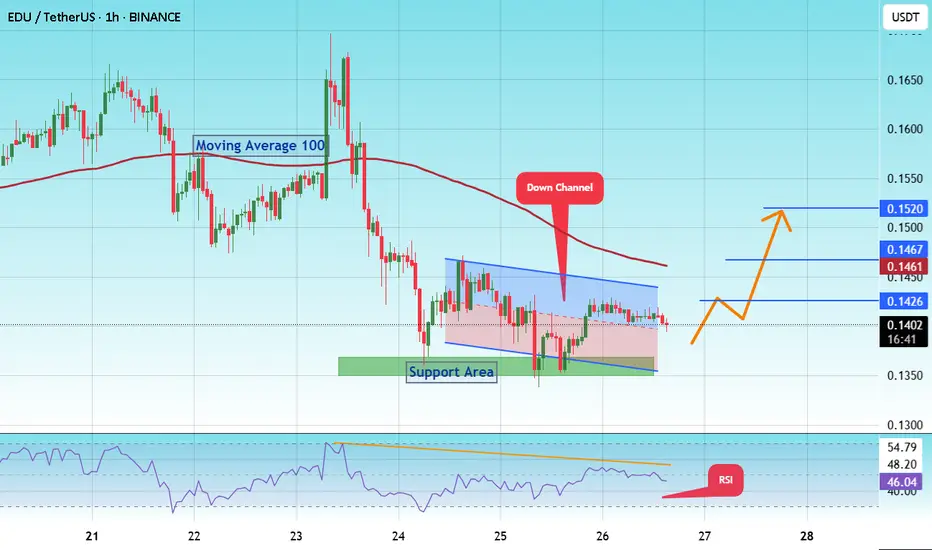
#EDU/USDT Forming Descending Triangle#EDU
The price is moving within a descending channel on the 1-hour frame and is expected to break and continue upward.
We have a trend to stabilize above the 100 moving average once again.
We have a downtrend on the RSI indicator that supports the upward break.
We have a support area at the lowe
#EDU/USDT#EDU
The price is moving within a descending channel on the 1-hour frame, adhering well to it, and is on its way to breaking strongly upwards and retesting it.
We have support from the lower boundary of the descending channel, at 0.1464.
We have a downtrend on the RSI indicator that is about to be

EDU/USDT “CZ’s baby”EDU, often dubbed “CZ’s baby”, is currently sitting at its under value price zone, forming a solid support base for a potential upcoming leg. After a strong reversal in April 2025, buyers stepped in aggressively around the $0.10 zone, which now acts as a key demand area.
Currently retraced nearly 4

EDUUSDT 1D#EDU is on the verge of breaking out above the Descending Broadening Wedge resistance and the daily MA50 — a strong technical setup.
If the breakout confirms, potential upside targets are:
🎯 $0.1738
🎯 $0.2183
🎯 $0.2956
🎯 $0.3580
⚠️ Always use a tight stop-loss to manage risk and protect your capi

EDUUSDT Forming Descending TriangleEDUUSDT has recently broken out of a descending triangle pattern on the daily timeframe, which is typically a bullish signal when confirmed with volume. The breakout has occurred with notable strength and solid green candle momentum, indicating a potential trend reversal and the beginning of a stron

#EDU/USDT#EDU
The price is moving within a descending channel on the 1-hour frame, adhering well to it, and is heading toward a strong breakout and retest.
We are experiencing a rebound from the lower boundary of the descending channel. This support is at 0.1400.
We are experiencing a downtrend on the RSI

#Edu/USDY#EDU
The price is moving within a descending channel on the 1-hour frame and is expected to break and continue upward.
We have a trend to stabilize above the 100 moving average once again.
We have a downtrend on the RSI indicator that supports the upward move with a breakout.
We have a support a

EDU give me my lost moneyEDU has bounced from the strong support zone between 0.0932 and 0.1252, now approaching the key resistance at 0.1614. A confirmed breakout above this level could open the way for a rapid move toward the 0.22–0.41 range due to the low-volume gap in between. However, RSI is still below 40, indicating

#EDU/USDT#EDU
The price is moving in a descending channel on the 1-hour frame and is adhering to it well and is heading to break it strongly upwards and retest it
We have a bounce from the lower limit of the descending channel, this support is at a price of 0.2600
We have a downtrend on the RSI indicator

See all ideas
Summarizing what the indicators are suggesting.
Oscillators
Neutral
SellBuy
Strong sellStrong buy
Strong sellSellNeutralBuyStrong buy
Oscillators
Neutral
SellBuy
Strong sellStrong buy
Strong sellSellNeutralBuyStrong buy
Summary
Neutral
SellBuy
Strong sellStrong buy
Strong sellSellNeutralBuyStrong buy
Summary
Neutral
SellBuy
Strong sellStrong buy
Strong sellSellNeutralBuyStrong buy
Summary
Neutral
SellBuy
Strong sellStrong buy
Strong sellSellNeutralBuyStrong buy
Moving Averages
Neutral
SellBuy
Strong sellStrong buy
Strong sellSellNeutralBuyStrong buy
Moving Averages
Neutral
SellBuy
Strong sellStrong buy
Strong sellSellNeutralBuyStrong buy
Displays a symbol's price movements over previous years to identify recurring trends.
Frequently Asked Questions
The current price of EDU / TetherUS (EDU) is 0.1388 USDT — it has fallen −5.45% in the past 24 hours. Try placing this info into the context by checking out what coins are also gaining and losing at the moment and seeing EDU price chart.
EDU / TetherUS price has fallen by −12.64% over the last week, its month performance shows a 6.52% increase, and as for the last year, EDU / TetherUS has decreased by −77.16%. See more dynamics on EDU price chart.
Keep track of coins' changes with our Crypto Coins Heatmap.
Keep track of coins' changes with our Crypto Coins Heatmap.
EDU / TetherUS (EDU) reached its highest price on Apr 29, 2023 — it amounted to 1.6950 USDT. Find more insights on the EDU price chart.
See the list of crypto gainers and choose what best fits your strategy.
See the list of crypto gainers and choose what best fits your strategy.
EDU / TetherUS (EDU) reached the lowest price of 0.0500 USDT on Apr 28, 2023. View more EDU / TetherUS dynamics on the price chart.
See the list of crypto losers to find unexpected opportunities.
See the list of crypto losers to find unexpected opportunities.
The safest choice when buying EDU is to go to a well-known crypto exchange. Some of the popular names are Binance, Coinbase, Kraken. But you'll have to find a reliable broker and create an account first. You can trade EDU right from TradingView charts — just choose a broker and connect to your account.
Crypto markets are famous for their volatility, so one should study all the available stats before adding crypto assets to their portfolio. Very often it's technical analysis that comes in handy. We prepared technical ratings for EDU / TetherUS (EDU): today its technical analysis shows the sell signal, and according to the 1 week rating EDU shows the sell signal. And you'd better dig deeper and study 1 month rating too — it's sell. Find inspiration in EDU / TetherUS trading ideas and keep track of what's moving crypto markets with our crypto news feed.
EDU / TetherUS (EDU) is just as reliable as any other crypto asset — this corner of the world market is highly volatile. Today, for instance, EDU / TetherUS is estimated as 2.81% volatile. The only thing it means is that you must prepare and examine all available information before making a decision. And if you're not sure about EDU / TetherUS, you can find more inspiration in our curated watchlists.
You can discuss EDU / TetherUS (EDU) with other users in our public chats, Minds or in the comments to Ideas.