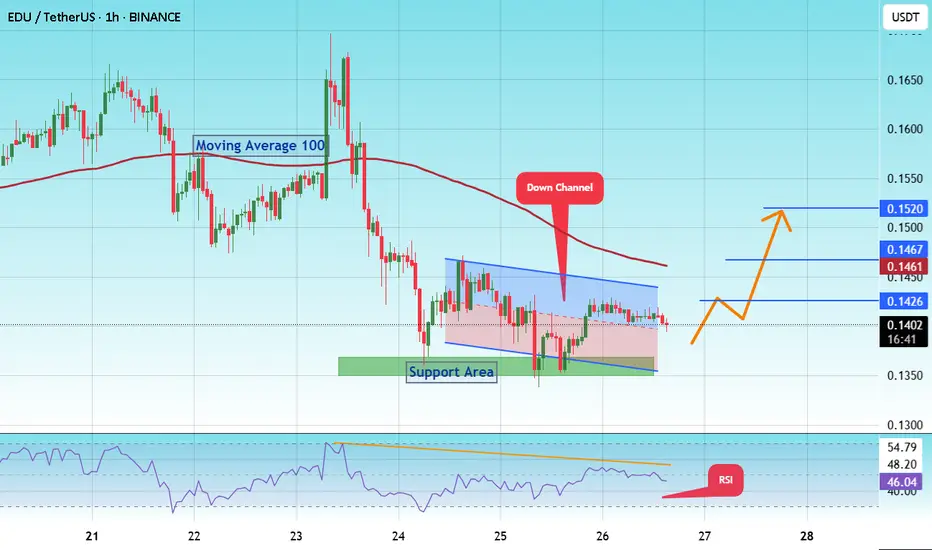
#EDU/USDT Forming Descending Triangle#EDU
The price is moving within a descending channel on the 1-hour frame and is expected to break and continue upward.
We have a trend to stabilize above the 100 moving average once again.
We have a downtrend on the RSI indicator that supports the upward break.
We have a support area at the lower boundary of the channel at 0.1300, acting as a strong support from which the price can rebound.
We have a major support area in green that pushed the price upward at 0.1350.
Entry price: 0.1400.
First target: 0.1426.
Second target: 0.1460.
Third target: 0.1520.
To manage risk, don't forget stop loss and capital management.
When you reach the first target, save some profits and then change your stop order to an entry order.
For inquiries, please comment.
Thank you.
EDUUSDT trade ideas
#EDU/USDT#EDU
The price is moving within a descending channel on the 1-hour frame, adhering well to it, and is on its way to breaking strongly upwards and retesting it.
We have support from the lower boundary of the descending channel, at 0.1464.
We have a downtrend on the RSI indicator that is about to be broken and retested, supporting the upside.
There is a major support area in green at 0.1442, which represents a strong basis for the upside.
Don't forget a simple thing: ease and capital.
When you reach the first target, save some money and then change your stop-loss order to an entry order.
For inquiries, please leave a comment.
We have a trend to hold above the 100 Moving Average.
Entry price: 0.1487
First target: 0.1528
Second target: 0.1570
Third target: 0.1620
Don't forget a simple thing: ease and capital.
When you reach your first target, save some money and then change your stop-loss order to an entry order.
For inquiries, please leave a comment.
Thank you.

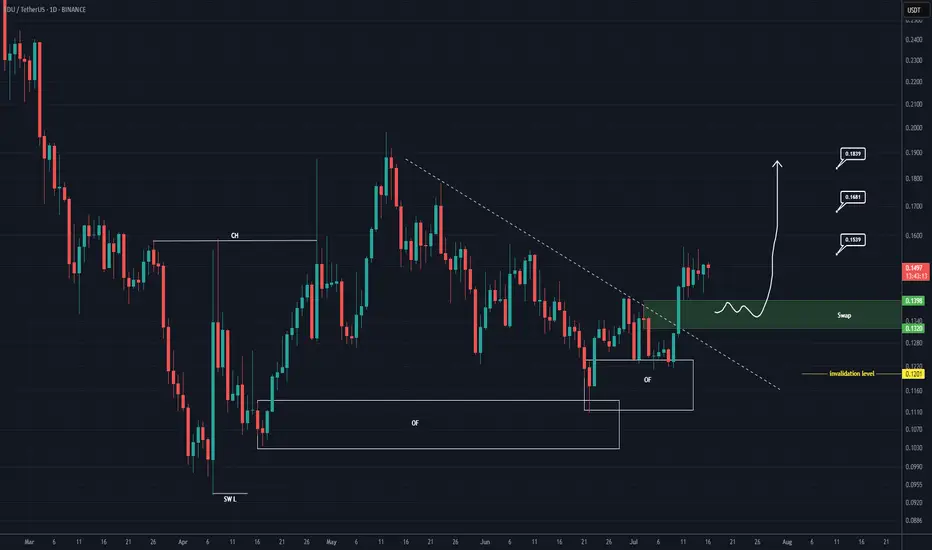
EDU Buy/Long Setup (1D)After forming a swing low, the price has created a bullish Change of Character (CH), and it has flowed well from the origin order blocks.
The trigger line has been broken, and the price has formed a SWAP zone.
Given the bullish signs on the chart, we can consider entering a buy position within the SWAP zone.
The targets are marked on the chart.
A daily candle closing below the invalidation level will invalidate this analysis.
For risk management, please don't forget stop loss and capital management
When we reach the first target, save some profit and then change the stop to entry
Comment if you have any questions
Thank You
EDU/USDT “CZ’s baby”EDU, often dubbed “CZ’s baby”, is currently sitting at its under value price zone, forming a solid support base for a potential upcoming leg. After a strong reversal in April 2025, buyers stepped in aggressively around the $0.10 zone, which now acts as a key demand area.
Currently retraced nearly 40% from its recent pump, EDU is showing early signs of accumulation and strength. Given its backing and low market cap exposure, it remains one of the most underrated plays heading into the next altcoin season.

EDUUSDT 1D#EDU is on the verge of breaking out above the Descending Broadening Wedge resistance and the daily MA50 — a strong technical setup.
If the breakout confirms, potential upside targets are:
🎯 $0.1738
🎯 $0.2183
🎯 $0.2956
🎯 $0.3580
⚠️ Always use a tight stop-loss to manage risk and protect your capital.

EDUUSDT Forming Descending TriangleEDUUSDT has recently broken out of a descending triangle pattern on the daily timeframe, which is typically a bullish signal when confirmed with volume. The breakout has occurred with notable strength and solid green candle momentum, indicating a potential trend reversal and the beginning of a strong upward move. With price currently trading near $0.1499, this technical breakout opens the door for a projected gain of 60% to 70%+ in the coming days or weeks.
EDU, the native token of the Open Campus project, is gaining attention as the Web3 education narrative grows stronger. As traditional sectors like education integrate blockchain, EDU stands out as a project with real-world utility and adoption potential. The fundamentals are aligning well with the technical picture, and the increased investor interest is starting to reflect in both volume spikes and social media chatter.
If EDUUSDT maintains support above the breakout trendline, traders could see a continuation toward the $0.25 to $0.27 region — aligning with the chart projection of nearly 80% upside. This setup is further supported by increasing market sentiment, and EDU’s strategic partnerships in the education sector make this move fundamentally sound.
This is a high-potential setup for traders looking to ride breakout momentum in trending altcoins. EDU is not just riding the wave of hype but is backed by utility, strong technical structure, and market interest — making it a standout in the current altcoin rotation.
✅ Show your support by hitting the like button and
✅ Leaving a comment below! (What is You opinion about this Coin)
Your feedback and engagement keep me inspired to share more insightful market analysis with you!

#EDU/USDT#EDU
The price is moving within a descending channel on the 1-hour frame, adhering well to it, and is heading toward a strong breakout and retest.
We are experiencing a rebound from the lower boundary of the descending channel. This support is at 0.1400.
We are experiencing a downtrend on the RSI indicator, which is about to break and retest, supporting the upward trend.
We are heading toward stability above the 100 Moving Average.
Entry price: 0.1434
First target: 0.1463
Second target: 0.1488
Third target: 0.1522

#Edu/USDY#EDU
The price is moving within a descending channel on the 1-hour frame and is expected to break and continue upward.
We have a trend to stabilize above the 100 moving average once again.
We have a downtrend on the RSI indicator that supports the upward move with a breakout.
We have a support area at the lower limit of the channel at 0.1500, which acts as strong support from which the price can rebound.
Entry price: 0.1576.
First target: 0.1670.
Second target: 0.1784.
Third target: 0.1905.

EDU give me my lost moneyEDU has bounced from the strong support zone between 0.0932 and 0.1252, now approaching the key resistance at 0.1614. A confirmed breakout above this level could open the way for a rapid move toward the 0.22–0.41 range due to the low-volume gap in between. However, RSI is still below 40, indicating that momentum remains weak and a clear trend reversal has not yet been confirmed. Entering new long positions without confirmation carries elevated risk.

#EDU/USDT#EDU
The price is moving in a descending channel on the 1-hour frame and is adhering to it well and is heading to break it strongly upwards and retest it
We have a bounce from the lower limit of the descending channel, this support is at a price of 0.2600
We have a downtrend on the RSI indicator that is about to break and retest, which supports the rise
We have a trend to stabilize above the moving average 100
Entry price 0.2604
First target 0.2677
Second target 0.2736
Third target 0.2824

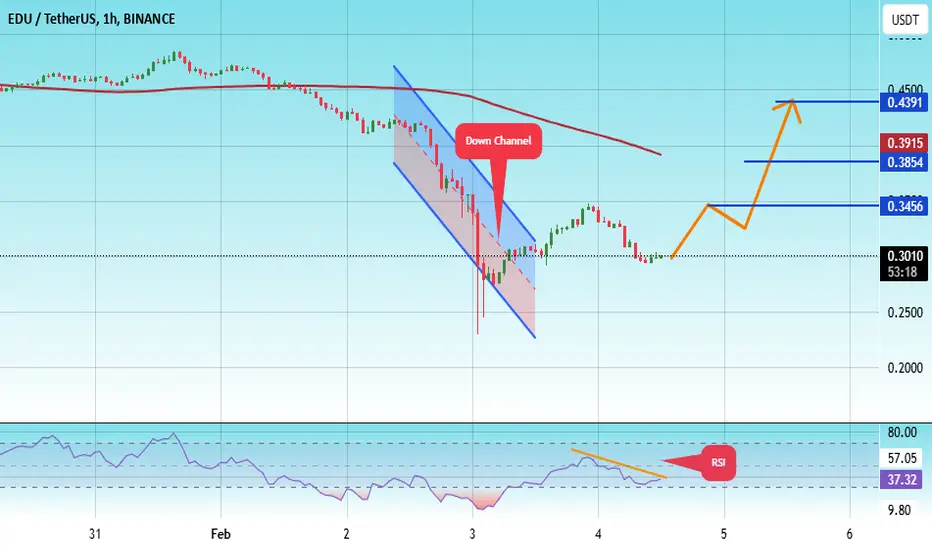
#EDU/USDT#EDU
The price is moving in a descending channel on the 1-hour frame and is adhering to it well and is heading to break it strongly upwards and retest it
We have a bounce from the lower limit of the descending channel, this support is at a price of 0.2300
We have a downtrend on the RSI indicator that is about to break and retest, which supports the rise
We have a trend to stabilize above the moving average 100
Entry price 0.2997
First target 0.3456
Second target 0.3854
Third target 0.4391
#EDU/USDT#EDU
The price is moving in a descending channel on the 1-hour frame and is expected to continue upwards
We have a trend to stabilize above the moving average 100 again
We have a descending trend on the RSI indicator that supports the rise by breaking it upwards
We have a support area at the lower limit of the channel at a price of 0.1700
Entry price 0.1742
First target 0.1774
Second target 0.1818
Third target 0.1860

Open Edu Surged 20% Today Gearing to Reclaim $100 Mln Mkt CapOpen Edu ( NYSE:EDU ) native token spike 20% today amidst breaking out of key resistant point setting the coast to reclaim the $100 million market cap.
Built on the BNB chain, The Open Campus Protocol is a decentralized solution for educators, content creators, parents, students, and co-publishers designed to address the major challenges in education today. Despite the critical role of educators in shaping the future generation, they are often undervalued and underpaid.
With growing interest in the world of web3.0 and NFT's, NYSE:EDU might just be a ticking time bomb that is setting the stage for a billion dollar in market cap.
As of the time of writing, NYSE:EDU is up 18% with build up momentum and RSI at 57, NYSE:EDU is gearing for a 50% breakout as conformation for the $100 million market cap sojourn.
Similarly, failure to break further above the resistant level could lead to a sell-off to the $0.096 support point.
Open Campus Price Data
The Open Campus price today is $0.153184 USD with a 24-hour trading volume of $69,244,194 USD. Open Campus is up 17.44% in the last 24 hours. The current CoinMarketCap ranking is #466, with a market cap of $62,914,963 USD. It has a circulating supply of 410,715,985 EDU coins and a max. supply of 1,000,000,000 EDU coins.

#EDU/USDT#EDU
The price is moving within a descending channel on the 1-hour frame, adhering well to it, and is on its way to breaking it strongly upwards and retesting it.
We are seeing a rebound from the lower boundary of the descending channel, which is support at 0.1430.
We have a downtrend on the RSI indicator that is about to break and retest, supporting the upward trend.
We are looking for stability above the 100 Moving Average.
Entry price: 0.1480
First target: 0.1511
Second target: 0.1540
Third target: 0.1580


EDUUSDT 4DEDU ~ 4D
#EDU If you still have a Conviction on this coin,. This is a very good support block for now. buy gradually with a minimum target of 20%

#EDU/USDT Ready to go higher #EDU
The price is moving in a descending channel on the 4-hour frame and sticking to it well
We have a bounce from the lower limit of the descending channel, this support is at 0.4834
We have a downtrend on the RSI indicator that is about to be broken, which supports the rise
We have a trend to stabilize above the moving average 100
Entry price 0.5070
First target 0.5447
Second target 0.5884
Third target 0.6300

EDUUSDT VIEWEDUUSDT seems to be aiming for a bullish direction against the daily fair value gap, achieving this will propel the market direction into a massive bearish trend after taking out the necessary
sell side liquidity.

#EDU/USDT #EDU
The price is moving in a descending channel on the 1-hour frame and is expected to continue upwards
We have a trend to stabilize above the moving average 100 again
We have a descending trend on the RSI indicator that supports the rise by breaking it upwards
We have a support area at the lower limit of the channel at a price of 0.5200
Entry price 0.5312
First target 0.5473
Second target 0.5668
Third target 0.5890

EDUUSDT Analysis: Key Demand ZoneThe blue box in EDUUSDT marks a high-value demand zone , making it a strong candidate for potential entry points.
Key Highlights:
Blue Box Significance: This zone is carefully identified using CDV, liquidity heatmaps, volume profiles, and volume footprints , ensuring precision and reliability.
Risk Management: The general market conditions are still volatile. It's essential to confirm entries with upward market structure breaks on lower time frames.
Patience Pays Off: Waiting for a meaningful reaction within the blue box could lead to better opportunities.
Learn My Techniques: Want to master tools like CDV, liquidity heatmaps, volume profiles, and volume footprints to identify accurate zones? DM me, and I'll teach you step by step!
Support and Motivate: If you find this analysis valuable, please boost and comment. Your encouragement inspires me to share more insights!
If you think this analysis helps you, please don't forget to boost and comment on this. These motivate me to share more insights with you!
I keep my charts clean and simple because I believe clarity leads to better decisions.
My approach is built on years of experience and a solid track record. I don’t claim to know it all, but I’m confident in my ability to spot high-probability setups.
If you would like to learn how to use the heatmap, cumulative volume delta and volume footprint techniques that I use below to determine very accurate demand regions, you can send me a private message. I help anyone who wants it completely free of charge.
My Previous Analysis (the list is long but I think it's kinda good : )
🎯 ZENUSDT.P: Patience & Profitability | %230 Reaction from the Sniper Entry
🐶 DOGEUSDT.P: Next Move
🎨 RENDERUSDT.P: Opportunity of the Month
💎 ETHUSDT.P: Where to Retrace
🟢 BNBUSDT.P: Potential Surge
📊 BTC Dominance: Reaction Zone
🌊 WAVESUSDT.P: Demand Zone Potential
🟣 UNIUSDT.P: Long-Term Trade
🔵 XRPUSDT.P: Entry Zones
🔗 LINKUSDT.P: Follow The River
📈 BTCUSDT.P: Two Key Demand Zones
🟩 POLUSDT: Bullish Momentum
🌟 PENDLEUSDT.P: Where Opportunity Meets Precision
🔥 BTCUSDT.P: Liquidation of Highly Leveraged Longs
🌊 SOLUSDT.P: SOL's Dip - Your Opportunity
🐸 1000PEPEUSDT.P: Prime Bounce Zone Unlocked
🚀 ETHUSDT.P: Set to Explode - Don't Miss This Game Changer
🤖 IQUSDT: Smart Plan
⚡️ PONDUSDT: A Trade Not Taken Is Better Than a Losing One
💼 STMXUSDT: 2 Buying Areas
🐢 TURBOUSDT: Buy Zones and Buyer Presence
🌍 ICPUSDT.P: Massive Upside Potential | Check the Trade Update For Seeing Results
🟠 IDEXUSDT: Spot Buy Area | %26 Profit if You Trade with MSB
📌 USUALUSDT: Buyers Are Active + %70 Profit in Total
🌟 FORTHUSDT: Sniper Entry +%26 Reaction
🐳 QKCUSDT: Sniper Entry +%57 Reaction
📊 BTC.D: Retest of Key Area Highly Likely
I stopped adding to the list because it's kinda tiring to add 5-10 charts in every move but you can check my profile and see that it goes on..

#EDU/USDT#EDU
The price is moving in a descending channel on a 30-minute frame and is expected to continue upwards
We have a trend to stabilize above the moving average 100 again
We have a descending trend on the RSI indicator that supports the rise by breaking it upwards
We have a support area at the lower limit of the channel at a price of 0.6288
Entry price 0.6288
First target 0.6700
Second target 0.7000
Third target 0.7415

Short Signal on EDUUSDT / Making profit even in Bleeding MarketBINANCE:EDUUSDT
📈Which side you pick?
Bull or Bear
Low-risk status: 3x-4x Leverage
Mid-risk status: 5x-8x Leverage
(For beginners, I suggest low risk status)
👾Note: The setup is active but expect the uncertain phase as well. also movement lines drawn to predict future price reactions are relative and approximate.
➡️Entry Area:
Yellow zone
⚡️TP:
0.6725
0.6375
0.5955
🔴SL:
0.7923
🧐The Alternate scenario:
If the price stabilizes against the direction of the position, below or above the trigger zone, the setup will be canceled.

EDUUSDTEDU is ready for a breakout after descending channel, possible entry points with stop loss and take profit are mentioned.
