Analysis of wdu/usdt by ict price action Tp1: trade is now open (x20_ margin 80$, entry 0.6328, tp =0.7911)
After that edu fill vi _Edu must fill the vi (volume imbalance) range _ then probably correct and touch Triangle floor. And then move toward that if break triangle 🔺️ then ...
Tp2: after break triangle tp2= 1.3$
Final tp = 1.7$
Good luck dear traders.
EDUUSDT trade ideas

#EDU/USDT#EDU
The price is moving in a descending channel on the 4-hour frame and sticking to it well
We have a bounce from the lower limit of the descending channel, this support is at 0.4230
We have an upward trend, the RSI indicator is about to break, which supports the rise
We have a trend to stabilize above the moving average 100
Entry price 0.4756
First target 0.4961
Second target 0.5328
Third target 0.5723

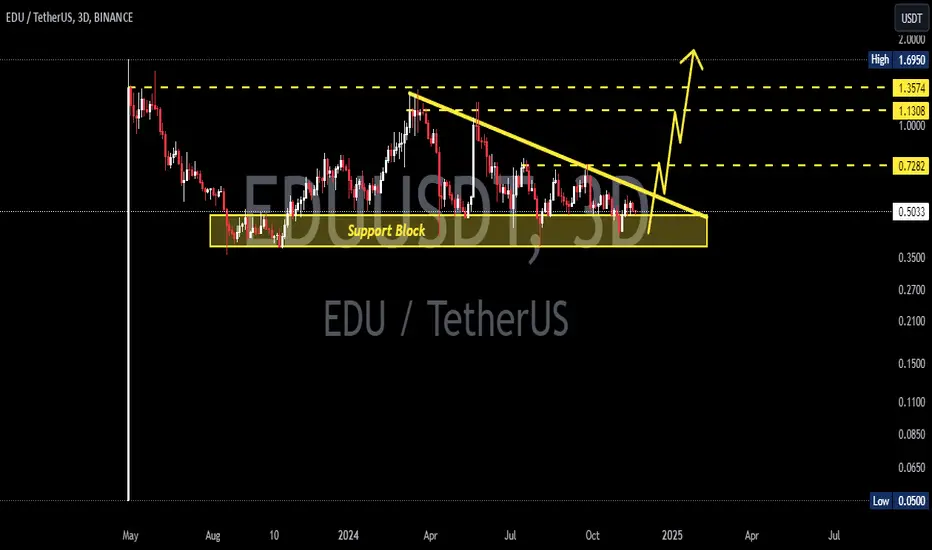
EDUUSDT 3DEDU ~ 3D
#EDU retest this support block,. if you still have Conviction on this coin,. Buy in stages from here. With a short term target of at least 20%+
EDUUSDT.P Long!EDUUSDT.P Long
Breakout confirmation!
.5330
TP - .9301
SL - .5050
Dyor
Tyor
Use low level only!
Happy trading!

Alikze »» EDU | Descending channel🔍 Technical analysis: Descending channel
- It is moving in a descending channel in the 8H time frame.
- At the bottom of the channel, a strong buying pressure candle has been encountered.
- Currently, we have to wait for the failure of the supply zone to exit the downward channel.
- If the supply zone breaks, it can have the targets of 0.9769 and 1.1719.
💎 Alternative scenario: In addition, if it encounters selling in the middle of the channel and below the supply range, it can retest the bottom of the channel. The first target of the downtrend will be the 0.39 range.
»»»«««»»»«««»»»«««
Please support this idea with a LIKE and COMMENT if you find it useful and Click "Follow" on our profile if you'd like these trade ideas delivered straight to your email in the future.
Thanks for your continued support.
Best Regards,❤️
Alikze.
»»»«««»»»«««»»»«««

Trade Signal Alert: EDUUSDTDirection: Sell
Enter Price: 0.6195
Take Profit: 0.59743333
Stop Loss: 0.64543333
Traders, we have identified a potential sell opportunity for the currency pair EDUUSDT using the EASY Quantum Ai strategy. Several key factors support this bearish sentiment:
1. Technical Analysis: The recent price action has shown a consistent pattern of lower highs and lower lows, indicating a downward trend. Additionally, the pair has been testing a significant resistance level around the 0.6400 mark, providing further bearish confirmation.
2. Momentum Indicators: Oscillators such as RSI and MACD have generated sell signals, reflecting weakened buying pressure and confirming the likelihood of further downward movement.
3. Market Sentiment: Broader market conditions and investor sentiment currently suggest risk aversion, typically leading to higher volatility and selling pressure on less stable assets such as EDUUSDT.
The strategy leverages market data to predict potential price movements. Please ensure you manage risk appropriately, using your Stop Loss and Take Profit levels effectively. Always conduct your own analysis before entering a trade.

Trading Signal Alert: EDUUSDTDear Traders,
We have identified a promising opportunity for the EDUUSDT trading pair using our advanced strategy, EASY Quantum Ai. Current market analysis and data trends suggest a downward movement in the near term, prompting us to recommend a Sell position.
Direction: Sell
Enter Price: 0.6195
Take Profit: 0.59743333
Stop Loss: 0.64543333
Our decision is based on several key factors:
1. Technical Analysis: Recent chart patterns indicate a bearish trend supported by technical indicators such as moving averages converging into a downward slope and the Relative Strength Index (RSI) showing overbought conditions.
2. Market Sentiment: Sentiment analysis shows a general nervousness around EDUUSDT due to recent fluctuations and external economic pressures, suggesting potential selling pressure.
3. Volume Analysis: We’ve observed a notable increase in selling volume, aligning with historical patterns of trend reversals at similar market conditions.
Please monitor the market closely and adjust your positions as necessary. Always consider your risk tolerance and trading strategy before entering trades.
Happy Trading!
EASY Quantum Ai Team

Trading Signal for EDUUSDT - Sell RecommendationDirection: Sell
Enter Price: 0.6633
Take Profit: 0.64823333
Stop Loss: 0.68883333
Attention traders! Following a thorough analysis using the EASY Quantum Ai strategy, we have identified a selling opportunity for the EDUUSDT currency pair. Here are the factors driving this recommendation:
1. Market Trends: Recent market movements and technical indicators suggest a prevailing bearish sentiment, making the short position appealing.
2. Price Patterns: The current chart patterns have revealed consolidations and potential breakdowns that align with a downward trend, providing a solid foundation for a sell prediction.
3. Momentum Indicators: RSI and MACD indicators reflect selling pressure with potential for further decline, reinforcing our sell position at the given entry price.
4. Sentiment Analysis: Market sentiment analysis indicates a growing consensus among traders expecting devaluation in the short term, supporting our strategy's outlook.
Please note that the use of the EASY Quantum Ai strategy has been pivotal in our analysis of these market conditions. Ensure you manage your risk effectively by setting the Take Profit at 0.64823333 and the Stop Loss at 0.68883333 as outlined. Always stay informed about market changes that could impact your trading decisions. Happy trading!

#EDU/USDT#EDU
The price is moving in a descending channel on the 4-hour frame upwards and is expected to continue
We have a trend to stabilize above the moving average 100 again
We have a downtrend on the RSI indicator that supports the rise by breaking it upwards
We have a support area at the lower limit of the channel at a price of 0.4800
Entry price 0.5200
First target 0.5791
Second target 0.6285
Third target 0.7047

#EDU/USDT#EDU
The price is moving in an ascending channel on the 1-day frame and is sticking to it very well
We have a bounce from a major support area in green at 0.4750
We have a downtrend on the RSI indicator that was broken upwards which supports the upside
We have a trend to stabilize above the 100 moving average which supports the upside
Entry price 0.5000
First target 0.6085
Second target 0.6638
Third target 0.7444

EDU Looks bullishFrom where we put the red arrow on the chart, it looks like a FLAT pattern is formed on the chart. The FLAT pattern has 3 ABC waves.
Wave C, which was a terminal pattern, has now ended and the price can move higher.
The targets are marked on the chart.
Closing a daily candle below the invalidation level will violate the analysis
For risk management, please don't forget stop loss and capital management
When we reach the first target, save some profit and then change the stop to entry
Comment if you have any questions
Thank You

EDU (The Bull-Run of Education Sector)NYSE:EDU
I expect two possible scenarios for #EDU.
Either a direct pump towards passing the confirmation @ $1.21 or a last drop above $0.35 then the bullish wave shall starts.
Breaking $0.35 invalidates the both bullish scenarios.

#EDU/USDT breaks the Diagonal Trndline in 4-Hour TF!#EDU/USDT breaks the Diagonal Trndline in 4-Hour TF!
Wait for a successful retest to long it. NYSE:EDU local support level is PDL $0.5078. The local resistance level is PWH $0.5618.

EDUUSDT.1DUpon examining the EDU/USDT daily chart, I'm identifying key technical elements that provide insight into the asset's performance and future direction. Here's a comprehensive breakdown:
Key Resistance and Support Levels:
Resistance 1 (R1) at $0.7913: This level currently stands as the primary resistance, a barrier that could cap upward movements. A breakthrough this level could signal strong bullish momentum.
Support 1 (S1) at $0.5920: This is the immediate support level where the price has found stability recently. Holding above this level is crucial for maintaining the current recovery.
Support 2 (S2) at $0.4834: Should S1 fail, S2 could be the next level where buyers might step in to arrest any further decline.
Technical Indicators:
MACD (Moving Average Convergence Divergence): The MACD line is just above the signal line, suggesting a bullish crossover recently occurred. This typically indicates potential upward momentum, although the closeness of the lines suggests caution as the trend strength isn't overwhelmingly strong.
RSI (Relative Strength Index): The RSI stands at 67, near the overbought territory but still under 70. This suggests the asset is experiencing increasing bullish momentum, though traders should be wary of potential pullbacks as the RSI approaches overbought levels.
Conclusion: Given the asset's current position near S1 and the bullish signs from MACD and RSI, there is potential for upward movement towards R1. I recommend closely monitoring the price action around these levels. A sustained break above R1 could open the path towards higher price levels, whereas a drop below S1 might necessitate reassessment, with possible targets near S2. Traders should consider using stop-loss orders to manage risks, particularly if the price moves against the anticipated direction. It's also advisable to stay updated on market news and sentiments that could influence price movements significantly.


EDUUSDTEDU ~ 2D
#EDU Maintaining this demand zone,. It looks like the Bulls will start to take control of the here.
We expect an increase of at least 20%+.

EDU sell/short setup (1D)Note, this is not a buy/long setup but a sell/short setup.
The EDU token is building a large liquidity pool at the bottom, eventually, this liquidity pool will be broken.
Our big structure is a bear.
We have a good supply range on the chart that if the price reaches this area, we can look for sell/short positions.
For risk management, please don't forget stop loss and capital management
Comment if you have any questions
Thank You

#EDU/USDT#EDU
The price is moving within a descending channel pattern on the 4-hour frame, which is a retracement pattern
We have a bounce from a major support area in the color EUR at 0.5300
We have a tendency to stabilize above the Moving Average 100
We have a downtrend on the RSI indicator that supports the rise and gives greater momentum and the price is based on it
Entry price is 0.5760
The first target is 0.6700
The second target is 0.7526
The third goal is 0.8467

EDUUSDT.1DAs I analyze the EDU/USDT chart, a few critical elements stand out in the current technical setup:
Support and Resistance Levels:
Support Levels (S1, S2, S3): The primary support level (S1) is currently at $0.5329. This level needs to hold to prevent further declines toward S2 and S3, which are significantly lower. The breach of S1 could trigger a sell-off, making these lower supports relevant.
Resistance Levels (R1, R2): The immediate resistance (R1) is not visible on this chart, but R2 is placed at $0.7913, indicating a potential upside target if the market sentiment turns bullish and EDU can break past its nearest resistance.
Technical Indicators:
Relative Strength Index (RSI): The RSI is at 52.38, suggesting a relatively balanced market condition with no immediate overbought or oversold signals. This level indicates that there is potential for movement in either direction without much resistance from RSI extremes.
Moving Average Convergence Divergence (MACD): The MACD is hovering just below the signal line but above zero, which suggests slight bearish momentum but not strong enough for significant concern. The proximity to the signal line also indicates potential for a reversal if bullish momentum picks up.
From this technical perspective, the strategy would be to closely monitor the $0.5329 support. If this level holds, it could serve as a springboard for price to test upper resistances, particularly aiming for a breakout above the nearest resistance level to target R2 at $0.7913. Given the current MACD and RSI readings, there's a cautious optimism that suggests a balanced approach, preparing for both potential advancement or retraction based on how strongly the price reacts at these key levels.
However, should S1 fail, the downside risk increases, and it would be wise to consider defensive measures such as tightening stop-loss orders to protect against a sharper decline. The neutrality shown by the RSI provides the flexibility to adapt quickly to changes, and thus, it's crucial to stay updated on any shifts in market dynamics that might influence EDU's price trajectory. This approach ensures readiness for either continuation of the current consolidation phase or a breakout/breakdown, depending on upcoming market developments.

Edu/Usdt Is Strong The EDU/USDT pair has confirmed an upside breakout after a temporary fakeout to the downside, indicating potential bullish momentum. A projected 60-120% price surge may occur in the coming days. Keep a close watch on this development, but remember this is not financial advice—conduct your research (DYOR).

The price might approach the $0.65 support levelEDU has been trending lower after breaking the previous support level and exiting a consolidation range. This decline indicates increased selling pressure and a potential shift in market sentiment. The current resistance level is at $0.80, which acts as a ceiling preventing upward movement. The price is continuing to decline and may approach the support area around $0.65.

eduusdteduusdt is consolidatimg inside this channel for quite sometime now .expecting a breakout soon
NFA

Trade Idea for Open Campus (EDU) - Accumulation StrategyOpen Campus (EDU) is currently trading at approximately $0.495. The token has experienced a decrease of 7.40% in the last 24 hours and a 10.21% decline over the past week. Its market capitalization is about $144.47 million, with a circulating supply of 292.08 million EDU tokens out of a maximum supply of 1 billion.
Begin by purchasing EDU at the current price of $0.495. This provides a strategic entry point given the recent price drop and potential for recovery.
Plan to accumulate additional EDU tokens at lower price points if the price drops to $0.44 and further to $0.385. This strategy allows for averaging down the entry price and capitalizing on market corrections.
Establish a series of take-profit targets to capture potential gains. The initial targets are set at $0.715, $0.99, and $1.375. These levels are chosen based on potential resistance points and historical price movements.
Open Campus is a decentralized solution aimed at addressing challenges in the education sector. It empowers educators and learners by decentralizing the creation and distribution of educational content, utilizing blockchain technology to ensure fairness and inclusivity. The NYSE:EDU token is integral to the ecosystem, facilitating payments, governance, and incentivizing content creation.
The recent price decline presents an opportunity for accumulation, especially given the project's strong fundamentals and potential for growth in the education sector. The long-term vision of revolutionizing the education industry and existing partnerships with entities like Animoca Brands and TinyTap enhance its value proposition.
Accumulating EDU at strategic price points leverages current market volatility and the potential for future growth. The phased profit-taking strategy is designed to optimize returns as the market potentially appreciates, driven by Open Campus's innovative approach to education and blockchain integration.
This trade idea is based on current market data and Open Campus’s strategic positioning as of May 2024. Cryptocurrency investments carry inherent risks, including the loss of principal. Investors should conduct their own research and consider their financial circumstances and risk appetite before engaging in cryptocurrency trading. This analysis is not financial advice.
