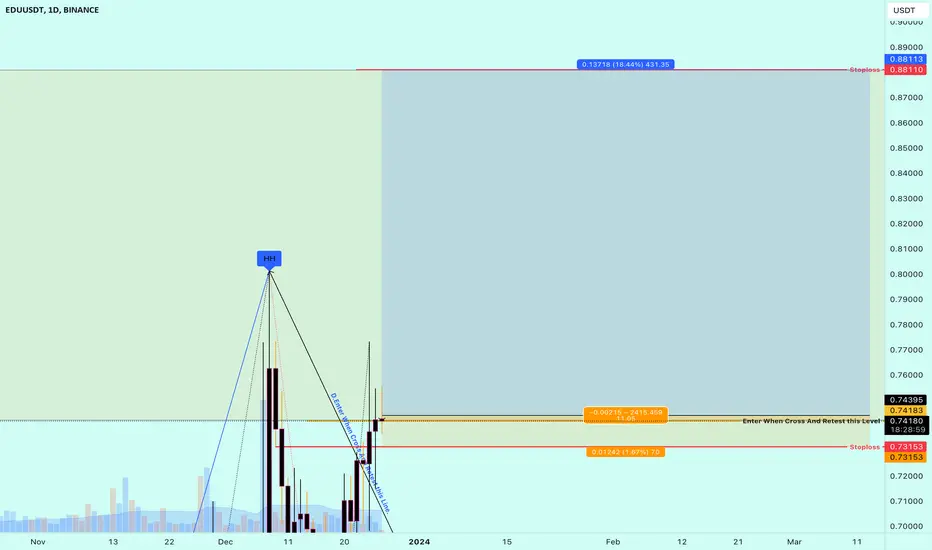
EDU ANALYSIS (1D)It seems that a large A wave that was a diametric has ended and we are now in a large B wave.
Wave B looks like an ABC as we are now in wave b of B. We expect to move from B to the green box to complete wave b. In fact, the green range is a suitable place for a Buy/Long position.
We specified the invalidation level. Closing a daily candle above this level will violate the analysis
For risk management, please don't forget stop loss and capital management
Comment if you have any questions
Thank You
EDUUSDT trade ideas

EDU Possible Long Trade #EDU Buy Setup
i will look to Long EDU here and this would be a nice Swing Trade, it should get more support and i see it could pump as soon as it breaks 0.66$ Area with a success Retest.
Entry: 0.56588
Entry 2: 0.42770
SL: 0.34819
Target 1: 0.79343
Target 2: 1.11530
Target 3: 1.55847
Target 4: 1.94187
if you use Leverage than consider to use not more than 10x depend on the Balance.
Cheers

#EDU/USDT
#EDU
The price has rebounded from the support area touching the trend line
On the hourly frame, the trend represents a good retracement area
With stability above the moving average of 100
Entry price is 0.6300
The first target is 0.6500
The second target is 0.6700
The third target is 0.6950

EDU Crypto's Next Move: Seize the Moment for Maximum Gains! 🚀**Short Fundamental**
EDUcoin is a decentralized and secure blockchain-based platform that aims to revolutionize the education industry. The platform enables educators to create and sell their courses, while students can purchase and access these courses from anywhere in the world. EDUcoin uses its own native cryptocurrency, EDU, to facilitate transactions on the platform.
**Recent News**
* EDUcoin announced a partnership with a leading education provider to offer a suite of blockchain-based courses.
* EDUcoin was featured in a major news article about the future of education technology.
* EDUcoin's price has been steadily increasing in recent months.
**Disclaimer**
EDUcoin is a relatively new cryptocurrency project, and there is no guarantee of its success. Please do your own research before investing in any cryptocurrency.
$EDU has started moving big waves!EDU completed a shake-out beat when it brought the price back to the $0.6 zone before pulling the candlestick back into the bullish channel. Currently, the 4H timeframe has also broken the down structure from the old top, confirming for a new uptrend to start.
See it at the moon!


buy some edui have set the target price only by market cap
entry only 1-5 % from your total investing

#EDU#EDU/USDT.P
In the previous idea, it was the reason for entry
The price is trading in a rising channel on a 15-minute frame, and the price has touched the upper border of the channel
Therefore, I was eager to land until the last night I had arrived, and that actually happened
I wanted to post this for clarification
Thank you all

EDU scalping StrategyYou can clearly see the buy and sell prints. So what goes up has to come there and I expect EDU to come to the buy point as target. DYOR
That white line can also be a target because many coins touch that white line and bounce up again

🔥EDU: Another Binance Freshman Is Ready To 🚀EDU fall by -77% and now consolidationg inside the channel and wide accumulation area.
The closest resistance levels are higher by +74% and +293% (local highs). Test the channel as the support will be a good sign to continue the growth.
💥do you know what happened to such "fresh" altcoins? check APT and WRX chart after the listing.
like❤️ and follow
Check the links and get a gift from me👇

EDU Buy Signal (testing support)EDU is now printing a bullish engulfing candle which can show us that support levels are being tested before it can go higher *trading 101 basic stuff...
We can see so many signals right now... i will make time to scan the market more often
and leave the party for later *bear market :))
See U
and take care
If you want to talk about coins (as a project) or coins (as charts) drop a comment !

EDUUSDT"As we enter the bullish season, the initial target to aim for is
target : 11 🎯.
This is based on a combination of technical analysis indicators and market trends.
However, it's important to approach trading with caution and adapt to changing market
conditions.
Keep an eye on key support and resistance levels, as well as any significant news or events that may impact the market.
Remember to use proper risk management techniques and consider setting profit targets along the way.
Happy trading!"

$EDU - Top Coin to watchNYSE:EDU forming a huge parrabolic formation, its mean a bullish sign.
Buy and hold with target on the chart (blue line)
Red line is buy zone.

EDU/USDTEdu is about to break a critical resistance level and price may reach higher levels.
Resistance and support levels are shown on the chart.
This is not a Financial Advice.
If you like the idea, dont forget to smash up the like button.
Thanks :)

$EDUI think EDU and Cyber are this cycle Axie infinity. This one could touch in 2 years.
Not a TA but an investment.

EDU USDT Perpetual likely to move downHi guys,
I will be concentrating more on crypto futures from now on
First idea on EDUUSDT

EDU BUILDING TO BREAKEDU is building a trend for the next break
Since 20-10-2023 it has had a running trend and it can be confirmed in the coming days.

EDUUSDT Descending Channel!EDUUSDT Technical Analaysis Update
Buy zone : Below $0.495
Stop loss : $0.460
Take Profit 1 : $0.526
Take Profit 2 : $0.600
Take Profit 3 : $0.745
Always Keep Stop Loss
Thanks
Hexa

Possible trades on EDUUSDTEDU had braked out the structure on 4H time frame. Looking forward to take on pullback.

EDU breakout Soon What Is a Descending Channel?
A descending channel is drawn by connecting the lower highs and lower lows of a security's price with parallel trendlines to show a downward trend. Officially, the space between the trendlines is the descending channel, which falls under the broad category of trend channels.
KEY TAKEAWAYS
A descending channel is drawn by connecting the lower highs and lower lows of a security's price with parallel trendlines to show a downward trend.
Traders who believe a security is likely to remain within its descending channel can initiate trades when the price fluctuates within its channel trendline boundaries.
A more potent signal occurs with a breakout, which is when a security's price breaches an established channel's boundaries, either on the upper or lower side.

✴️ Open Campus iHead & Shoulders (140% Bullish Potential)Here is another young chart, but these cannot be ignored due to the chart being young because the signals are really strong.
Open Campus (EDUUSDT) ... Let's dive in!
✔️ Today is really high volume.
We have a Doji where bulls and bear fought but the bulls ended with the upper hand, making today's session pretty strong.
✔️ inverse Head & Shoulders pattern
✔️ Volume can be seen decreasing as a bottom is hit and rising as the trend starts to change.
✔️ Indicators are bullish as well.
I don't know who I am sharing this for as I don't see many people reading... But I hope it is useful to someone.
I am hoping you can make big profits and reach your goals.
You deserve the best, always.
Namaste.

EDU targetsEDU is trading at the lows...no signs of reversal yet..
If btc dominance starts to drop more.. EDU may also recover its losses
Holders should always have some targets in sight..in case of a pump
Also dump targets = red lines (DCA)
Good Luck!

EDU buy TradeHere is My Study On EDU
Welcome to my channel! Here you'll find daily technical analysis ofthe latest trends in the crypto market. From Bitcoin to altcoins, I'lIl be sharing my insights and predictions to help you make informed decisions
about your investments. Follow me for the latest updates and join the conversation in the comments!
Crypto technical analysis uses past price history to predict future price. It's not a guarantee and shouldn't be relied on solely for investment decisions. Consider other factors such as market trends, economic strength and
information dissemination. Use with caution.
This Is Not A Finacial Advise
