Bearish case if we are in Distribution!So we need to overcome 30 weekly average to be bullish. If not, I would say we can repeat the rejection of the past and go as far down as 23$ as a final step by end of March to recover from there, as last point of the Wyckoff distribution schematic.
I estimated target bottom by looking at previous S/R levels and using a pitchfork to get the diagonal lines that cross that S/R levels.
EGLDUSD trade ideas

Elliot Wave count on EGLD/USDOn this EW weekly count, it seems that we are in the buy zone. The 1-2, and 3-4 legs respect the EW rules and they hit the targets accordingly. The fib levels also confirm this scenario. This is a long-term play but the good part is that the longer the time interval the higher the probability of working out and of course the higher the payout.


Scenarios for EGLDWe just broke Resistance 1, but there is another Resistance 2. Even for Resistance 1, it could be a Fakeout. As per the Wedge that has formed, I would be inclined to see three touches on the lower side (only two for the moment), so I would not be surprise to go under previous low, also as a spring of the accumulation. This is still a bearish evaluation, less damage that in my previous related idea (see it linked).

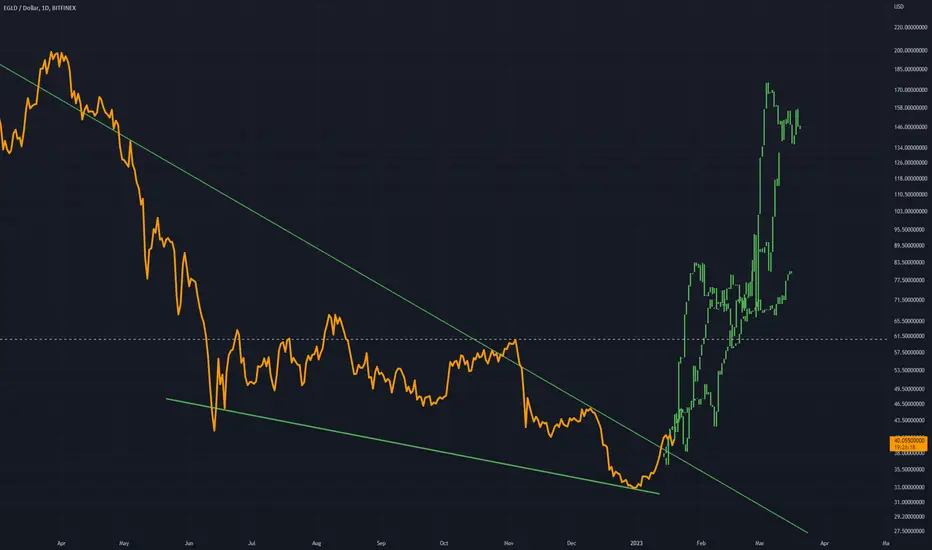
✴️ Elrond Back Above Support | Bulls ConfirmedThe blue dashed line on this chart marks the low that Elrond (EGLDUSD) produced back in January 2023/December 2022, this is a most important level as it precedes a bullish wave that followed a strong bear market.
Seeing this pair going below this level is definitely bad news, the good news is that EGLD is now back above it and this confirms the bullish bias.
With the bullish bias confirmed, we can expect prices to grow.
The MACD is still below zero (bearish zone) yet trending higher and already showing a bullish cross.
This tells us that the tendency is bullish and we have plenty of room available for growth.
Namaste.

$EGLD bullish scenario.BINANCE:EGLDUSDT
Investing in cryptocurrencies like MultiversX TSXV:EGLD can be uncertain and risky. The technology is still new, and it's hard to predict the future. There are potential issues with regulations, security, and whether people will actually use these digital currencies.
Cryptocurrency prices can change a lot, sometimes very quickly. It's important to be mentally prepared for these ups and downs. It's best to think long-term and not make impulsive decisions based on short-term changes.
Regulations for cryptocurrencies are still being figured out, and they can affect how things work. There are also security risks, so it's important to protect your digital assets with secure wallets and good online security practices.
Before investing in MultiversX and TSXV:EGLD or any other cryptocurrency, do your research, understand the risks involved, and be patient. It's a new and exciting opportunity, but it's important to approach it with caution and a long-term perspective.

Some EGLD HOPIUMIn shadows deep, where darkness hides,
A flicker stirs, where hope abides.
Through weary hearts and troubled souls,
It whispers softly, making us whole.
In dreams we seek, a distant shore,
Where troubled waters rage no more.
With eyes alight, we dare to dream,
And find in hope, a steady beam.
Though storms may rage, and winds may blow,
Hope blooms within, a light to show.
Through darkest nights, it guides our way,
A beacon strong, come what may.
Yet, caution sings, a subtle tune,
For hope can wander to the moon.
In opium's guise, it may deceive,
But true hope's touch, we must believe.
So let us seek, with open eyes,
A hope that's pure, that never lies.
In balanced steps, with hearts set free,
We'll find the hope that sets us free.
Signed by: chatGPT :-D

EGLDUSD hit the 1W MA50 for the first time in 1 year!Elrond (EGLDUSD) hit today its 1W MA50 (blue trend-line) for the first time since April 2022. If it manages to close a 1W candle above it, it will be a major buy signal. On top of that, the long-term pattern appears to be an Inverse Head and Shoulders (IH&S), which technically is a formation that emerges on market bottoms. As a result, if we get that 1W candle close above the 1W MA50, we will buy and our technical target will be the 2.0 Fibonacci level at 93.00.
-------------------------------------------------------------------------------
** Please LIKE 👍, FOLLOW ✅, SHARE 🙌 and COMMENT ✍ if you enjoy this idea! Also share your ideas and charts in the comments section below! **
-------------------------------------------------------------------------------
💸💸💸💸💸💸
👇 👇 👇 👇 👇 👇

EGLD to 29.5 USDCurrently we are in a descending channel (falling wedge) so I expect that it will reach 29 ish due to Elliot Wave theory ABC


EGLDUSD between the 1D MA50 and 200 waiting for a break-out!Elrond (EGLDUSD) is rebounding since yesterday after coming very close to the 1D MA50 (blue trend-line), which has been supporting since the January 13 bullish break-out. Practically after the February 08 rejection, it has been ranging within the 1D MA50 and the 1D MA200 (orange trend-line) waiting for a break-out to gain volume.
With the 1D RSI on a Channel Down (i.e. Bearish Divergence) similar to October 04 - November 03, we may see a strong correction towards the market bottom if the price closes a 1D candle below the 1D MA50. On the other hand, since the longer term pattern has been a Channel Up since the June 13 Low, a closing above the 1D MA200, will be a bullish break-out for us, targeting the top of the Channel Down.
A pattern that may have gone unnoticed and could be the one that will influence the price the most, is the Inverse Head and Shoulders (IH&S) that started forming after the November 09 drop of the FTX crash. Its 0.618 - 0.5 Fibonacci retracement levels are the Support Zone so far, its 1.5 Fibonacci extension can coincide with a Lower High on the Channel Down, and if broken, our ultimate target will be the 2.0 Fib extension.
-------------------------------------------------------------------------------
** Please LIKE 👍, FOLLOW ✅, SHARE 🙌 and COMMENT ✍ if you enjoy this idea! Also share your ideas and charts in the comments section below! **
-------------------------------------------------------------------------------
💸💸💸💸💸💸
👇 👇 👇 👇 👇 👇

[UPDATE EGLD] Nothing changed. What if?As I mentioned before, we could be currently in stage 2 of this inflationary bear market. This means that inflation peaked in September and we can expect to see lower inflation for a few months, followed by a recession. This will likely lead to more bear market rallies until the Federal Reserve intervenes again and introduces more money into the market, leading to another market crash in mid-2023 (stage 3). This will cause inflation to skyrocket again, leading to a depression phase (stage 4). If I were to visualize these phases in a chart and use EGLD as a reference, it would look like this.
THIS IS A STAGE 2 SCENARIO.
Reclaim 38 and we can talk about "deviation" for now


EGLD - Strong Breakout Idea An Idea suggesting a breakout of this wedge structure and movement higher will come
Optimal area for price to be would be along the white dashed line
Breakout please
#EGLD Egld/USD -4h Chart#EGLD - we have multiple confluences and probabilities.
Analysis is done for the swing trade opportunity.
The first scenario is more optimistic showing only a retrace and continuing the trend. But there is a possibility that the price may liquidate the trendline and make a consolidation at the extreme buy point before continuing its upward movement. Be cautious and do not risk too much.
Invalidation - after $32.22, continuing the downward trend."

Bull Forecasting...Expecting big things from alt layer ones in the future - should see this around $1800-2k~ per coin if I'm right.

the descending 3rd wave just startedafter it lost the 0.38 Fibo level at $40 it is going to 0.5 Fibo level at $17.8, 1.6(5) at $11.67, and 0.61 Fibo level at $7.7. it could rage between $10 and $20 for a while as the iv wave.

EGLD - Last Move Down IdeaOn this 4Hr chart EGLD is within a tight structure
A curved bowl formation has formed. I like to think that these break down bearishly and this works well with a strong support line in green.
From there I expect the bulls to take back control, its just a matter of when. I have pasted a bars pattern showing this awesome recovery.
Longing is always appropriate in this market.

EGLD to go to sub $20s and then ripppp to $1500 - $2000The title says it all man. We still go down 50% first and after that we gon see $1500-$2000 EGLD. IF it dont it dont. but im betting it iwll.
P.S - Not F.A
DYOR

Elliot Wave HTF $EGLD idea !I still expect a corrective move for Elrond for the completion of wave B for a 2-3X for the next year.
The whole idea it's in the chart. I would love to buy Elrond under 10$ for the BIG 3rd wave that wil begun in 2024.$$$$

Accumulate...Same story as many charts specifically alt L1's - the majority of alt L1's are growing a lot faster than ETH did which I believe will cause prices to rise on many of these projects a lot faster than ETH did in the future as the network effects take over and adoption comes. Also note that a monthly pivot has formed here at the top which is usually indicative of a larger wave 1 and I'm of the belief that where we bottom will give us our 2nd Monthly pivot confirming a larger wave 1-2.

EGLD.USD ,buy oportunity be carefulRR= 1-4, i buy from here 42.8 usd entry price.
let's see how it goes
